Washington University in St. Louis School of Medicine, 660 S Euclid Ave, St. Louis, MO 63110, USA.
Washington University in St. Louis School of Medicine, 660 S Euclid Ave, St. Louis, MO 63110, USA; Knight Alzheimer Disease Research Center, 4488 Forest Park Pkwy, St. Louis, MO 63108, USA.
Neuroimage Clin. 2020;26:102248. doi: 10.1016/j.nicl.2020.102248. Epub 2020 Mar 16.
Volumetric biomarkers for Alzheimer disease (AD) are attractive due to their wide availability and ease of administration, but have traditionally shown lower diagnostic accuracy than measures of neuropathological contributors to AD. Our purpose was to optimize the diagnostic specificity of structural MRIs for AD using quantitative, data-driven techniques.
This retrospective study assembled several non-overlapping cohorts (total n = 1287) with publicly available data and clinical patients from Barnes-Jewish Hospital (data gathered 1990-2018). The Normal Aging Cohort (n = 383) contained amyloid biomarker negative, cognitively normal (CN) participants, and provided a basis for determining age-related atrophy in other cohorts. The Training (n = 216) and Test (n = 109) Cohorts contained participants with symptomatic AD and CN controls. Classification models were developed in the Training Cohort and compared in the Test Cohort using the receiver operating characteristics areas under curve (AUCs). Additional model comparisons were done in the Clinical Cohort (n = 579), which contained patients who were diagnosed with dementia due to various etiologies in a tertiary care outpatient memory clinic.
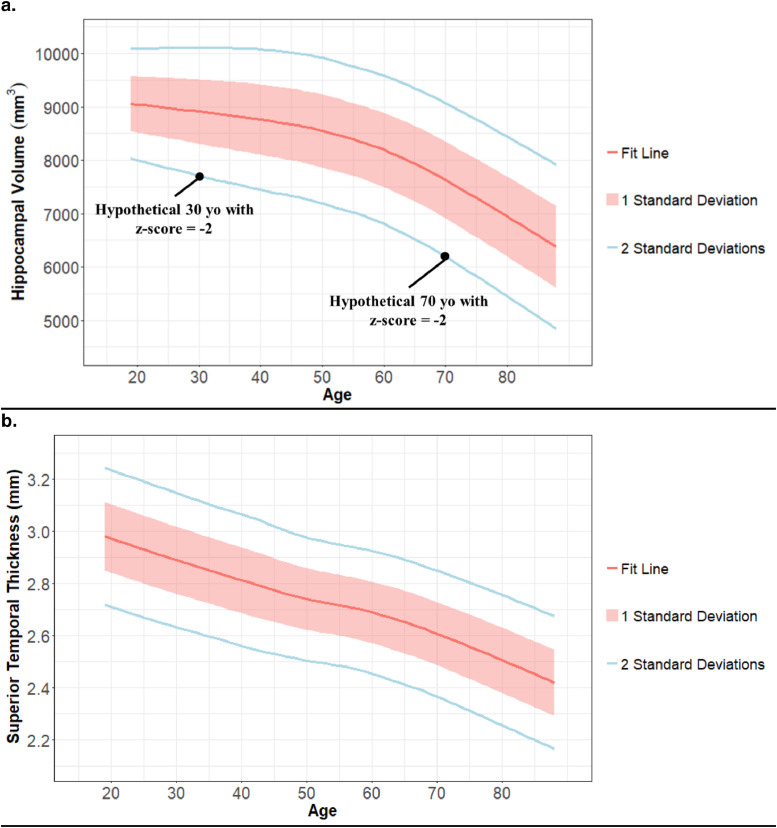
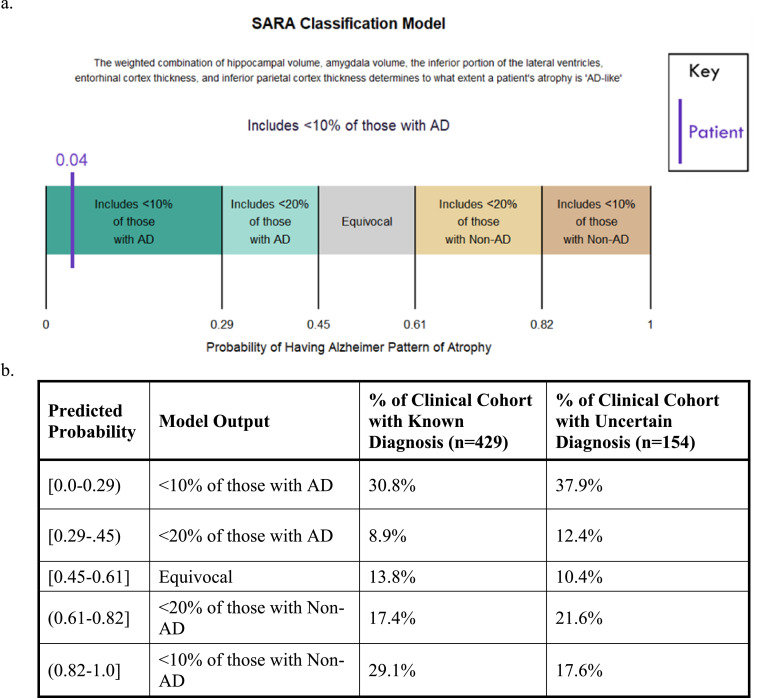
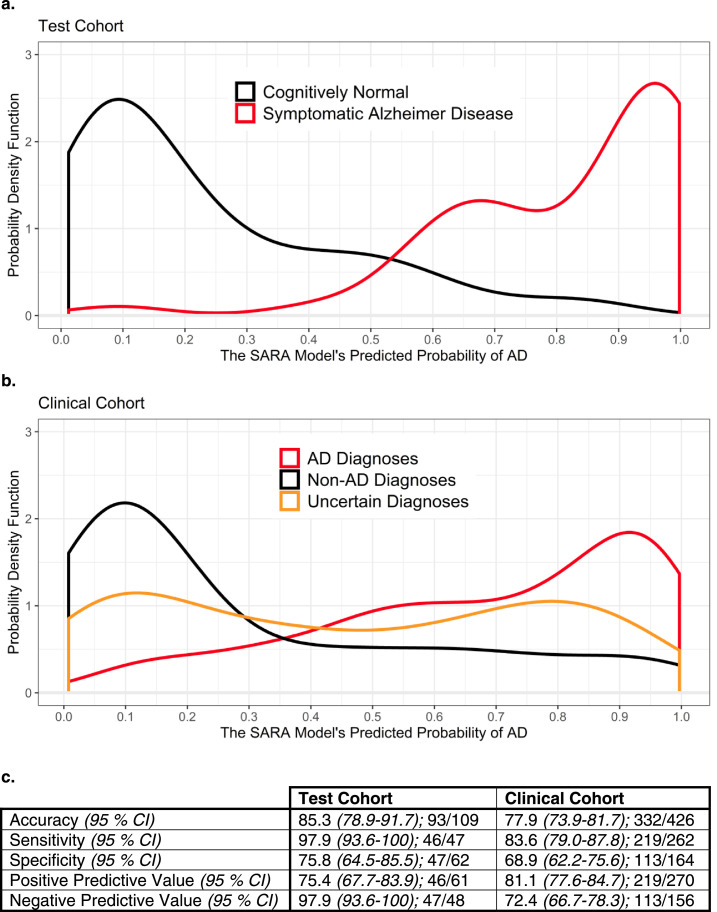
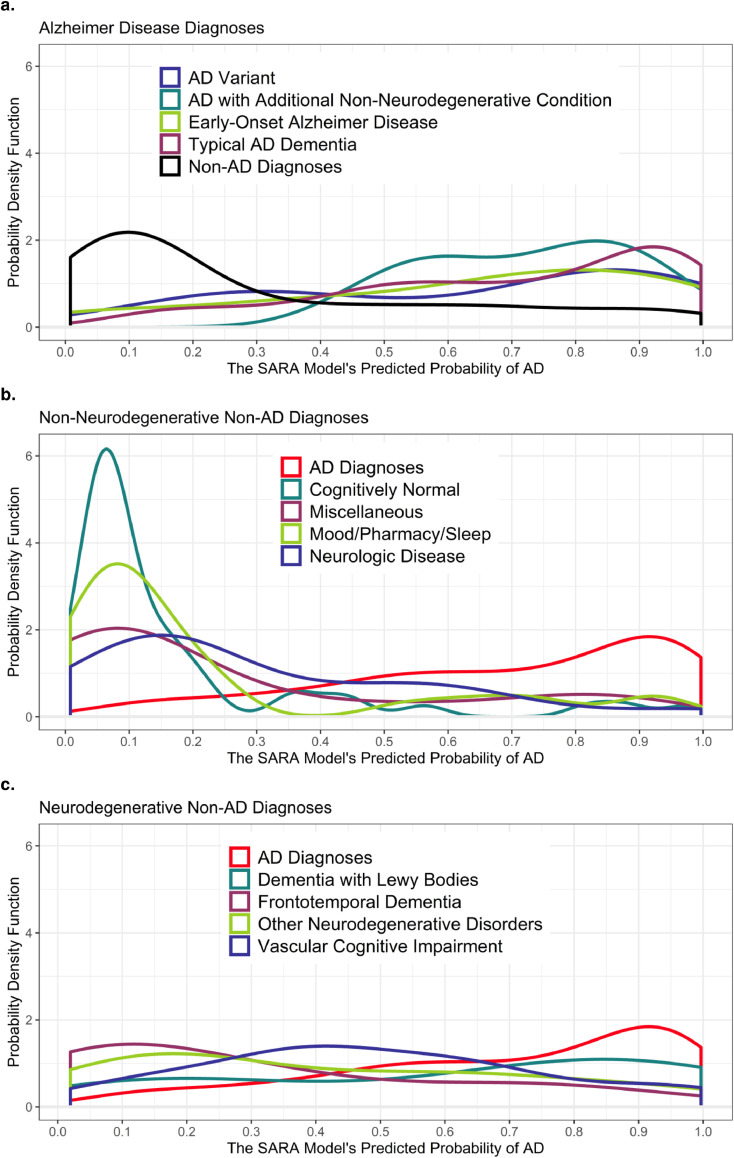
While the Normal Aging Cohort showed regional age-related atrophy, classification models were not improved by including age as a predictor or by using volumetrics adjusted for age-related atrophy. The optimal model used multiple regions (hippocampal volume, inferior lateral ventricle volume, amygdala volume, entorhinal thickness, and inferior parietal thickness) and was able to separate AD and CN controls in the Test Cohort with an AUC of 0.961. In the Clinical Cohort, this model separated AD from non-AD diagnoses with an AUC 0.820, an incrementally greater separation of the cohort than by hippocampal volume alone (AUC of 0.801, p = 0.06). Greatest separation was seen for AD vs. frontotemporal dementia and for AD vs. non-neurodegenerative diagnoses.
Volumetric biomarkers distinguished individuals with symptomatic AD from CN controls and other dementia types but were not improved by controlling for normal aging.
由于容积生物标志物在获取和实施方面具有广泛的优势,因此它们在阿尔茨海默病(AD)的诊断中具有吸引力,但其诊断准确性通常低于 AD 神经病理学指标。我们的目的是使用定量、数据驱动的技术优化 AD 结构 MRI 的诊断特异性。
本回顾性研究汇集了几个非重叠队列(总 n=1287),包括来自巴恩斯-犹太医院的公开数据和临床患者(数据收集于 1990-2018 年)。正常老化队列(n=383)包含阴性淀粉样蛋白生物标志物、认知正常(CN)的参与者,为其他队列中确定与年龄相关的萎缩提供了基础。训练队列(n=216)和测试队列(n=109)包含有症状 AD 患者和 CN 对照组。在训练队列中开发分类模型,并在测试队列中使用接受者操作特征曲线下面积(AUC)进行比较。在包含在三级护理门诊记忆诊所因各种病因被诊断为痴呆的患者的临床队列(n=579)中进行了额外的模型比较。
虽然正常老化队列显示出与年龄相关的区域性萎缩,但通过将年龄作为预测因子或通过使用针对与年龄相关的萎缩进行调整的容积来改善分类模型的效果不佳。最优模型使用了多个区域(海马体积、外侧下脑室体积、杏仁核体积、内嗅皮质厚度和下顶叶厚度),能够在测试队列中以 0.961 的 AUC 将 AD 和 CN 对照组分开。在临床队列中,该模型以 0.820 的 AUC 将 AD 与非 AD 诊断分开,比单独使用海马体积(AUC 为 0.801,p=0.06)更能区分队列。AD 与额颞叶痴呆和 AD 与非神经退行性疾病的诊断之间的分离最大。
容积生物标志物可区分有症状的 AD 患者和 CN 对照组及其他痴呆类型,但通过控制正常老化,其效果并未得到改善。