• 文献检索
  • 文档翻译
  • 深度研究
  • 学术资讯
  • Suppr Zotero 插件Zotero 插件
  • 邀请有礼
  • 套餐&价格
  • 历史记录
应用&插件
Suppr Zotero 插件Zotero 插件浏览器插件Mac 客户端Windows 客户端微信小程序
定价
高级版会员购买积分包购买API积分包
服务
文献检索文档翻译深度研究API 文档MCP 服务
关于我们
关于 Suppr公司介绍联系我们用户协议隐私条款
关注我们

Suppr 超能文献

核心技术专利:CN118964589B侵权必究
粤ICP备2023148730 号-1Suppr @ 2026

文献检索

告别复杂PubMed语法,用中文像聊天一样搜索,搜遍4000万医学文献。AI智能推荐,让科研检索更轻松。

立即免费搜索

文件翻译

保留排版,准确专业,支持PDF/Word/PPT等文件格式,支持 12+语言互译。

免费翻译文档

深度研究

AI帮你快速写综述,25分钟生成高质量综述,智能提取关键信息,辅助科研写作。

立即免费体验

预测巴西的新冠疫情动态:一种数据驱动的方法。

Forecasting Covid-19 Dynamics in Brazil: A Data Driven Approach.

机构信息

Department of Computer Engineering and Automation, Federal University of Rio Grande do Norte, Natal 59078-970, RN, Brazil.

Department of Computer Science, Federal Institute of Rio Grande do Norte, Mossoro 59628-330, RN, Brazil.

出版信息

Int J Environ Res Public Health. 2020 Jul 15;17(14):5115. doi: 10.3390/ijerph17145115.

DOI:10.3390/ijerph17145115
PMID:32679861
原文链接:https://pmc.ncbi.nlm.nih.gov/articles/PMC7400194/
Abstract

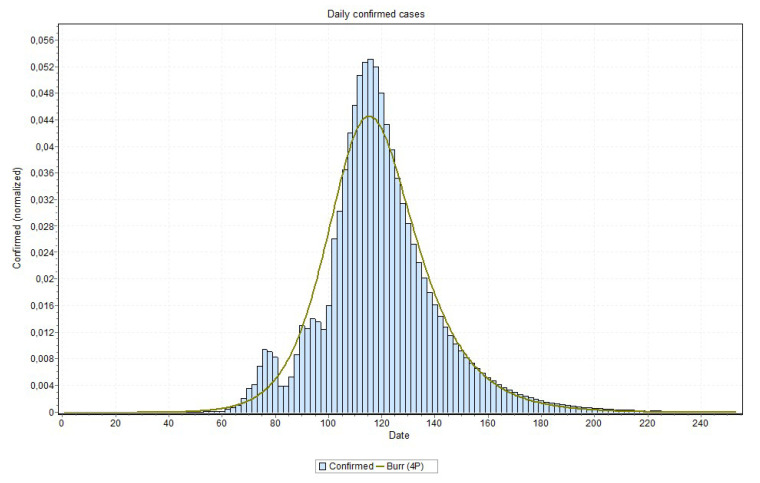
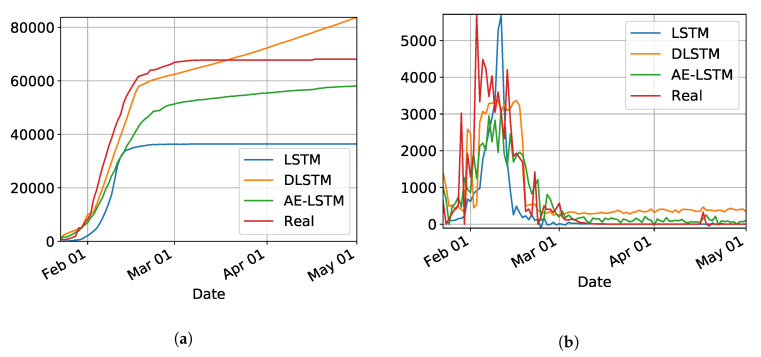
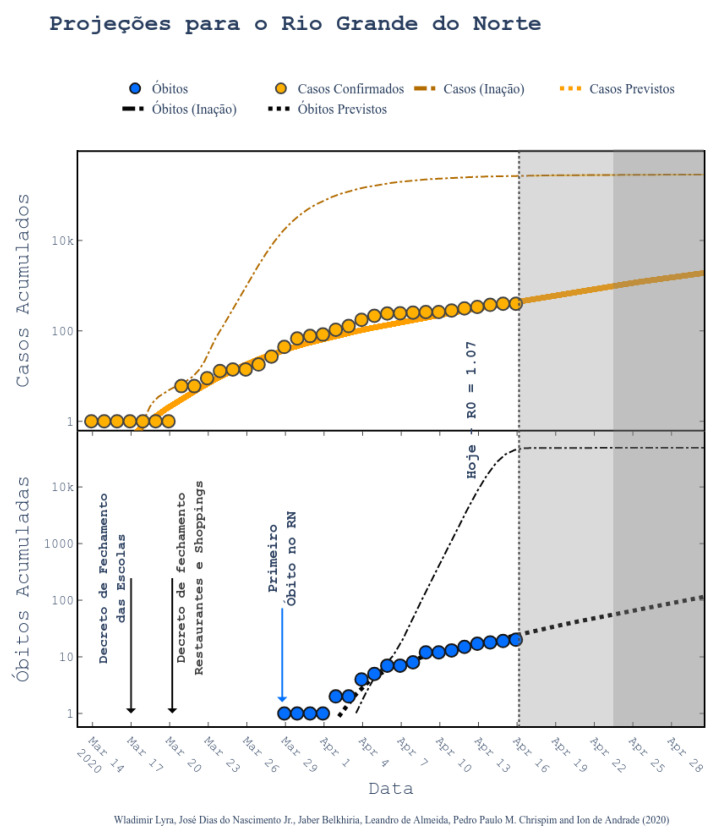
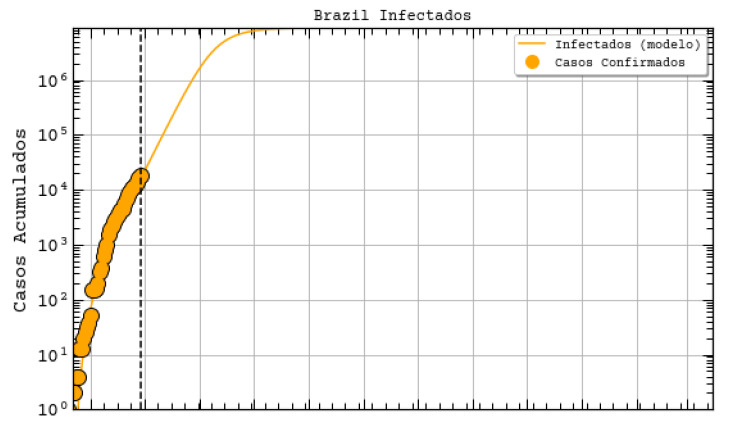
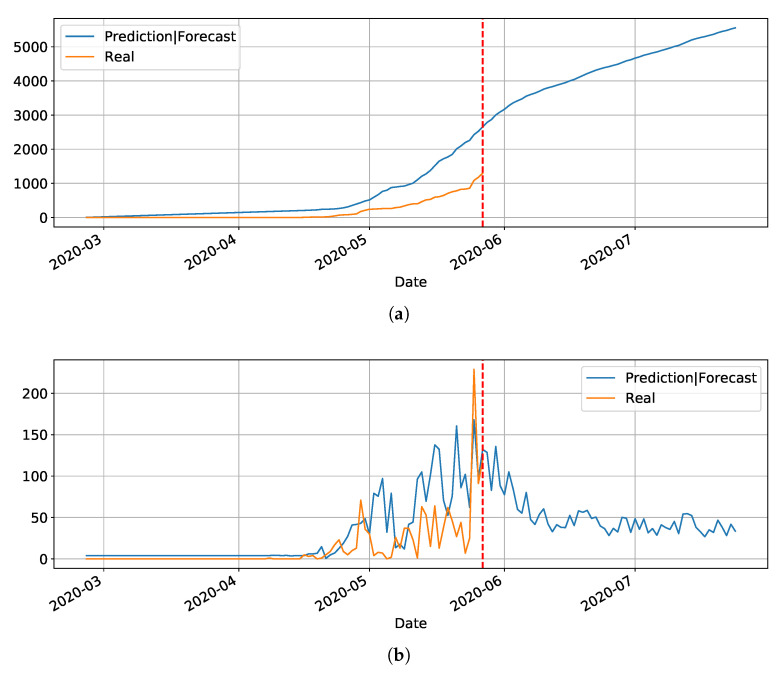
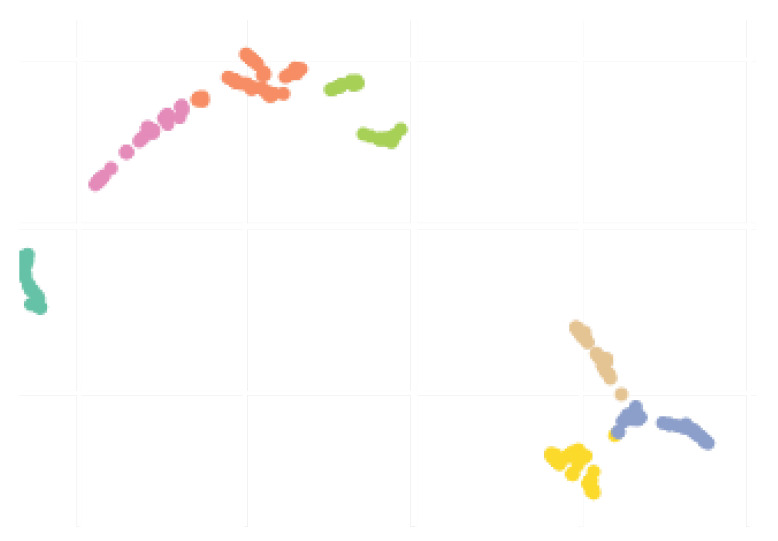
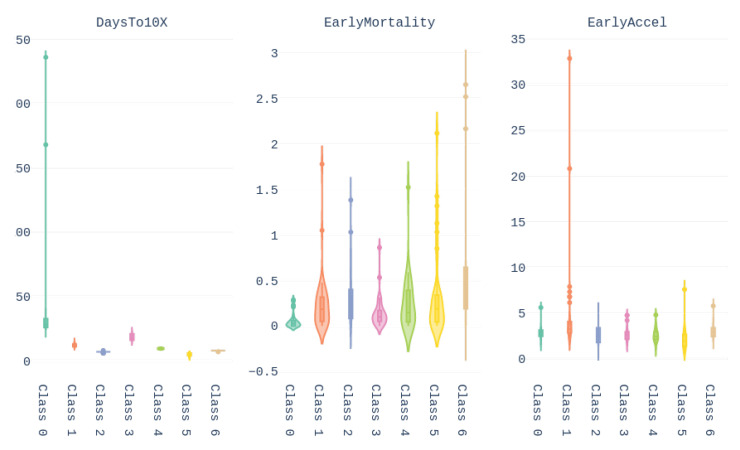
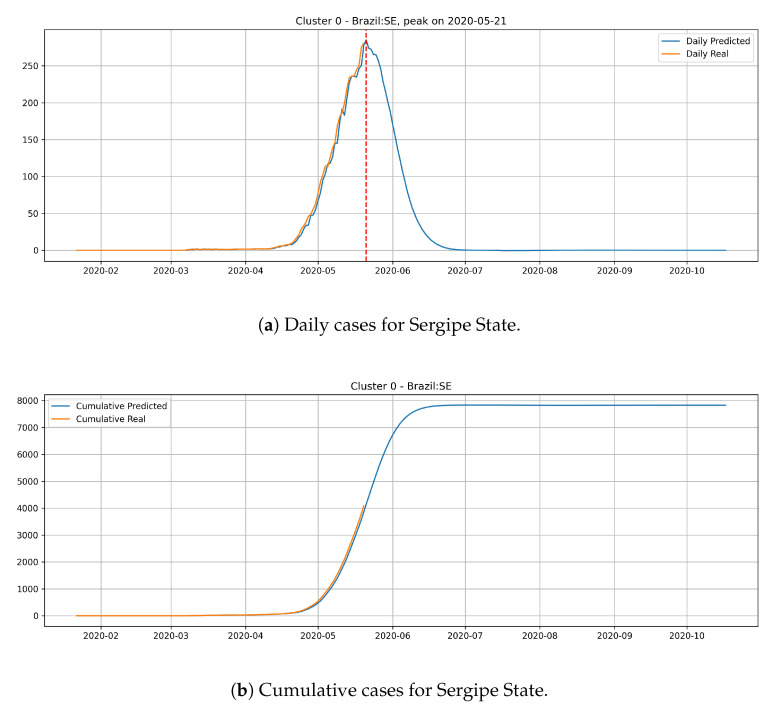
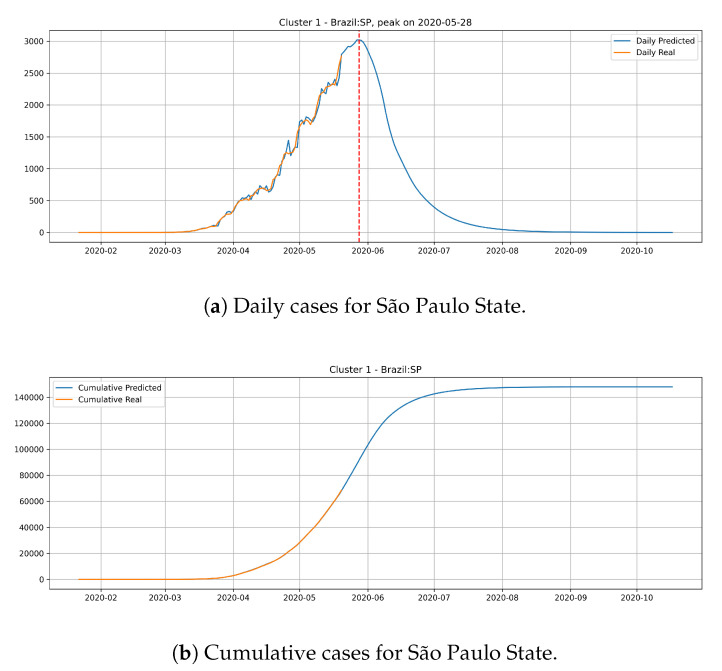
The contribution of this paper is twofold. First, a new data driven approach for predicting the Covid-19 pandemic dynamics is introduced. The second contribution consists in reporting and discussing the results that were obtained with this approach for the Brazilian states, with predictions starting as of 4 May 2020. As a preliminary study, we first used an Long Short Term Memory for Data Training-SAE (LSTM-SAE) network model. Although this first approach led to somewhat disappointing results, it served as a good baseline for testing other ANN types. Subsequently, in order to identify relevant countries and regions to be used for training ANN models, we conduct a clustering of the world's regions where the pandemic is at an advanced stage. This clustering is based on manually engineered features representing a country's response to the early spread of the pandemic, and the different clusters obtained are used to select the relevant countries for training the models. The final models retained are Modified Auto-Encoder networks, that are trained on these clusters and learn to predict future data for Brazilian states. These predictions are used to estimate important statistics about the disease, such as peaks and number of confirmed cases. Finally, curve fitting is carried out to find the distribution that best fits the outputs of the MAE, and to refine the estimates of the peaks of the pandemic. Predicted numbers reach a total of more than one million infected Brazilians, distributed among the different states, with São Paulo leading with about 150 thousand confirmed cases predicted. The results indicate that the pandemic is still growing in Brazil, with most states peaks of infection estimated in the second half of May 2020. The estimated end of the pandemics (97% of cases reaching an outcome) spread between June and the end of August 2020, depending on the states.

摘要

本文的贡献有两点。首先,提出了一种新的数据驱动方法来预测新冠疫情动态。第二个贡献是报告和讨论了该方法在巴西各州的预测结果,预测始于 2020 年 5 月 4 日。作为初步研究,我们首先使用了长短期记忆数据训练 - 自编码器(LSTM-SAE)网络模型。尽管这种最初的方法导致了一些令人失望的结果,但它为测试其他 ANN 类型提供了一个良好的基线。随后,为了确定可用于训练 ANN 模型的相关国家和地区,我们对疫情处于高级阶段的世界各地区进行了聚类。这种聚类是基于代表国家对疫情早期传播的反应的手动设计特征,获得的不同聚类用于选择相关国家进行模型训练。最终保留的模型是修改后的自动编码器网络,它们在这些聚类上进行训练,以学习预测巴西各州的未来数据。这些预测用于估计疾病的重要统计数据,例如峰值和确诊病例数。最后,进行曲线拟合以找到最适合 MAE 输出的分布,并改进疫情峰值的估计。预测的数字达到了超过 100 万的感染巴西人,分布在不同的州,圣保罗州预计有 15 万例确诊病例。结果表明,疫情在巴西仍在蔓延,大多数州的感染高峰期预计在 2020 年 5 月下旬。预计疫情结束(97%的病例达到结局)的时间在 6 月至 8 月底之间,具体取决于各州。

https://cdn.ncbi.nlm.nih.gov/pmc/blobs/2f72/7400194/7a2bb0af8e7a/ijerph-17-05115-g020.jpg
https://cdn.ncbi.nlm.nih.gov/pmc/blobs/2f72/7400194/fae1daf8f2cd/ijerph-17-05115-g001.jpg
https://cdn.ncbi.nlm.nih.gov/pmc/blobs/2f72/7400194/2d2022147ad4/ijerph-17-05115-g002.jpg
https://cdn.ncbi.nlm.nih.gov/pmc/blobs/2f72/7400194/5b3072d0949b/ijerph-17-05115-g003.jpg
https://cdn.ncbi.nlm.nih.gov/pmc/blobs/2f72/7400194/0ffcee350bd5/ijerph-17-05115-g004.jpg
https://cdn.ncbi.nlm.nih.gov/pmc/blobs/2f72/7400194/9153c1c1410a/ijerph-17-05115-g005.jpg
https://cdn.ncbi.nlm.nih.gov/pmc/blobs/2f72/7400194/4e59625f33b3/ijerph-17-05115-g006.jpg
https://cdn.ncbi.nlm.nih.gov/pmc/blobs/2f72/7400194/56eb39d3f2c6/ijerph-17-05115-g007.jpg
https://cdn.ncbi.nlm.nih.gov/pmc/blobs/2f72/7400194/dbc25d66dd60/ijerph-17-05115-g008.jpg
https://cdn.ncbi.nlm.nih.gov/pmc/blobs/2f72/7400194/1ea0c189053b/ijerph-17-05115-g009.jpg
https://cdn.ncbi.nlm.nih.gov/pmc/blobs/2f72/7400194/c93f5925b7ef/ijerph-17-05115-g010.jpg
https://cdn.ncbi.nlm.nih.gov/pmc/blobs/2f72/7400194/5190ceb611bd/ijerph-17-05115-g011.jpg
https://cdn.ncbi.nlm.nih.gov/pmc/blobs/2f72/7400194/e00ec9df8e71/ijerph-17-05115-g012a.jpg
https://cdn.ncbi.nlm.nih.gov/pmc/blobs/2f72/7400194/b40575c7604b/ijerph-17-05115-g013.jpg
https://cdn.ncbi.nlm.nih.gov/pmc/blobs/2f72/7400194/2bf6ad38e8d3/ijerph-17-05115-g014.jpg
https://cdn.ncbi.nlm.nih.gov/pmc/blobs/2f72/7400194/17164011e179/ijerph-17-05115-g015.jpg
https://cdn.ncbi.nlm.nih.gov/pmc/blobs/2f72/7400194/4201ed29a8b7/ijerph-17-05115-g016.jpg
https://cdn.ncbi.nlm.nih.gov/pmc/blobs/2f72/7400194/dee036602285/ijerph-17-05115-g017.jpg
https://cdn.ncbi.nlm.nih.gov/pmc/blobs/2f72/7400194/6b85ec2c5ce3/ijerph-17-05115-g018.jpg
https://cdn.ncbi.nlm.nih.gov/pmc/blobs/2f72/7400194/785c2ce93693/ijerph-17-05115-g019.jpg
https://cdn.ncbi.nlm.nih.gov/pmc/blobs/2f72/7400194/7a2bb0af8e7a/ijerph-17-05115-g020.jpg

相似文献

1
Forecasting Covid-19 Dynamics in Brazil: A Data Driven Approach.预测巴西的新冠疫情动态:一种数据驱动的方法。
Int J Environ Res Public Health. 2020 Jul 15;17(14):5115. doi: 10.3390/ijerph17145115.
2
Short-term forecasting of daily COVID-19 cases in Brazil by using the Holt's model.使用霍尔特模型对巴西每日 COVID-19 病例进行短期预测。
Rev Soc Bras Med Trop. 2020 Jun 3;53:e20200283. doi: 10.1590/0037-8682-0283-2020. eCollection 2020.
3
Predicting the Epidemiological Outbreak of the Coronavirus Disease 2019 (COVID-19) in Saudi Arabia.预测 2019 年冠状病毒病(COVID-19)在沙特阿拉伯的流行病学爆发。
Int J Environ Res Public Health. 2020 Jun 25;17(12):4568. doi: 10.3390/ijerph17124568.
4
ARIMA modelling & forecasting of COVID-19 in top five affected countries.受影响最严重的五个国家的新冠疫情自回归移动平均模型建模与预测
Diabetes Metab Syndr. 2020 Sep-Oct;14(5):1419-1427. doi: 10.1016/j.dsx.2020.07.042. Epub 2020 Jul 28.
5
A SARS-CoV-2 Surveillance System in Sub-Saharan Africa: Modeling Study for Persistence and Transmission to Inform Policy.撒哈拉以南非洲的新冠病毒监测系统:关于持续存在和传播以指导政策的建模研究
J Med Internet Res. 2020 Nov 19;22(11):e24248. doi: 10.2196/24248.
6
Long-term forecasts of the COVID-19 epidemic: a dangerous idea.COVID-19 疫情的长期预测:一个危险的想法。
Rev Soc Bras Med Trop. 2020;53:e20200481. doi: 10.1590/0037-8682-0481-2020. Epub 2020 Aug 26.
7
Prediction for the spread of COVID-19 in India and effectiveness of preventive measures.预测 COVID-19 在印度的传播情况和预防措施的效果。
Sci Total Environ. 2020 Aug 1;728:138762. doi: 10.1016/j.scitotenv.2020.138762. Epub 2020 Apr 20.
8
A New Auto-Regressive Multi-Variable Modified Auto-Encoder for Multivariate Time-Series Prediction: A Case Study with Application to COVID-19 Pandemics.一种用于多变量时间序列预测的新型自回归多变量修正自编码器:以COVID-19大流行应用为例的研究
Int J Environ Res Public Health. 2024 Apr 18;21(4):497. doi: 10.3390/ijerph21040497.
9
Multiple Epidemic Wave Model of the COVID-19 Pandemic: Modeling Study.新冠疫情的多波流行模型:建模研究
J Med Internet Res. 2020 Jul 30;22(7):e20912. doi: 10.2196/20912.
10
A data-driven model to describe and forecast the dynamics of COVID-19 transmission.一个用于描述和预测 COVID-19 传播动态的数据驱动模型。
PLoS One. 2020 Jul 31;15(7):e0236386. doi: 10.1371/journal.pone.0236386. eCollection 2020.

引用本文的文献

1
A New Auto-Regressive Multi-Variable Modified Auto-Encoder for Multivariate Time-Series Prediction: A Case Study with Application to COVID-19 Pandemics.一种用于多变量时间序列预测的新型自回归多变量修正自编码器:以COVID-19大流行应用为例的研究
Int J Environ Res Public Health. 2024 Apr 18;21(4):497. doi: 10.3390/ijerph21040497.
2
Analysis of learning curves in predictive modeling using exponential curve fitting with an asymptotic approach.使用指数曲线拟合和渐近方法分析预测建模中的学习曲线。
PLoS One. 2024 Apr 18;19(4):e0299811. doi: 10.1371/journal.pone.0299811. eCollection 2024.
3
Analysis of epidemic spread dynamics using a PDE model and COVID-19 data from Hamilton County OH USA.

本文引用的文献

1
analysis of SARS-CoV-2 genomes: Insights from SARS encoded non-coding RNAs.分析 SARS-CoV-2 基因组:来自 SARS 编码非编码 RNA 的启示。
Front Cell Infect Microbiol. 2022 Nov 28;12:966870. doi: 10.3389/fcimb.2022.966870. eCollection 2022.
2
Modeling and forecasting the early evolution of the Covid-19 pandemic in Brazil.建模与预测巴西新冠疫情的早期演变。
Sci Rep. 2020 Nov 10;10(1):19457. doi: 10.1038/s41598-020-76257-1.
3
Effects of social distancing and isolation on epidemic spreading modeled via dynamical density functional theory.
使用偏微分方程模型和来自美国俄亥俄州汉密尔顿县的新冠疫情数据对疫情传播动态进行分析。
IFAC Pap OnLine. 2021;54(20):322-327. doi: 10.1016/j.ifacol.2021.11.194. Epub 2021 Dec 15.
4
Dynamic transmission modeling of COVID-19 to support decision-making in Brazil: A scoping review in the pre-vaccine era.支持巴西决策的新冠病毒动态传播建模:疫苗接种前时代的一项范围综述
PLOS Glob Public Health. 2023 Dec 13;3(12):e0002679. doi: 10.1371/journal.pgph.0002679. eCollection 2023.
5
Recent progress on wastewater-based epidemiology for COVID-19 surveillance: A systematic review of analytical procedures and epidemiological modeling.基于污水的新型冠状病毒肺炎监测的最新进展:分析程序和流行病学建模的系统评价。
Sci Total Environ. 2023 Jun 20;878:162953. doi: 10.1016/j.scitotenv.2023.162953. Epub 2023 Mar 21.
6
Unveiling conflicting strategies in the Brazilian response to COVID-19: A cross-sectional study using the Functional Resonance Analysis Method.揭示巴西应对新冠疫情的相互冲突策略:一项运用功能共振分析方法的横断面研究
Dialogues Health. 2022 Dec;1:100056. doi: 10.1016/j.dialog.2022.100056. Epub 2022 Oct 6.
7
COVID-19 Outbreak Forecasting Based on Vaccine Rates and Tweets Classification.基于疫苗接种率和推文分类的 COVID-19 疫情预测。
Comput Intell Neurosci. 2022 Oct 27;2022:4535541. doi: 10.1155/2022/4535541. eCollection 2022.
8
Artificial intelligence for forecasting and diagnosing COVID-19 pandemic: A focused review.人工智能在预测和诊断 COVID-19 大流行中的应用:一项重点综述。
Artif Intell Med. 2022 Jun;128:102286. doi: 10.1016/j.artmed.2022.102286. Epub 2022 Mar 28.
9
SARS-CoV-2 Delta and Omicron Variants Surge in Curitiba, Southern Brazil, and Its Impact on Overall COVID-19 Lethality.巴西南部库里蒂巴市的 SARS-CoV-2 Delta 和 Omicron 变异株激增及其对整体 COVID-19 致死率的影响。
Viruses. 2022 Apr 14;14(4):809. doi: 10.3390/v14040809.
10
A Framework for Inferring Epidemiological Model Parameters using Bayesian Nonparametrics.使用贝叶斯非参数推断流行病学模型参数的框架。
AMIA Annu Symp Proc. 2022 Feb 21;2021:217-226. eCollection 2021.
基于动力密度泛函理论对社交隔离与传染病传播关系的建模研究
Nat Commun. 2020 Nov 4;11(1):5576. doi: 10.1038/s41467-020-19024-0.
4
COVID-19 pandemics modeling with modified determinist SEIR, social distancing, and age stratification. The effect of vertical confinement and release in Brazil.基于修正的确定性 SEIR 模型、社交隔离和年龄分层对 COVID-19 大流行的建模。巴西垂直隔离和解除隔离的效果。
PLoS One. 2020 Sep 2;15(9):e0237627. doi: 10.1371/journal.pone.0237627. eCollection 2020.
5
Monitoring Italian COVID-19 spread by a forced SEIRD model.通过强制 SEIRD 模型监测意大利 COVID-19 传播。
PLoS One. 2020 Aug 6;15(8):e0237417. doi: 10.1371/journal.pone.0237417. eCollection 2020.
6
Eco-epidemiological assessment of the COVID-19 epidemic in China, January-February 2020.2020 年 1-2 月中国 COVID-19 疫情的生态流行病学评估。
Glob Health Action. 2020 Dec 31;13(1):1760490. doi: 10.1080/16549716.2020.1760490.
7
Covid-19 Outbreak Progression in Italian Regions: Approaching the Peak by the End of March in Northern Italy and First Week of April in Southern Italy.意大利各地区的新冠疫情进展:北部地区将于 3 月底达到高峰,南部地区将于 4 月初达到高峰。
Int J Environ Res Public Health. 2020 Apr 27;17(9):3025. doi: 10.3390/ijerph17093025.
8
Real-time estimation and prediction of mortality caused by COVID-19 with patient information based algorithm.基于患者信息算法的实时估计和预测 COVID-19 死亡率。
Sci Total Environ. 2020 Jul 20;727:138394. doi: 10.1016/j.scitotenv.2020.138394. Epub 2020 Apr 8.
9
Analysis and forecast of COVID-19 spreading in China, Italy and France.新冠病毒在中国、意大利和法国传播情况的分析与预测。
Chaos Solitons Fractals. 2020 May;134:109761. doi: 10.1016/j.chaos.2020.109761. Epub 2020 Mar 21.
10
Why is it difficult to accurately predict the COVID-19 epidemic?为什么准确预测新冠疫情很困难?
Infect Dis Model. 2020;5:271-281. doi: 10.1016/j.idm.2020.03.001. Epub 2020 Mar 25.