Department of Mathematics, University of California Irvine, Irvine, CA 92697, USA.
Department of Microbiology and Immunology, Cornell University College of Veterinary Medicine, Cornell University, Ithaca, NY 14853, USA.
J R Soc Interface. 2020 Sep;17(170):20200518. doi: 10.1098/rsif.2020.0518. Epub 2020 Sep 30.
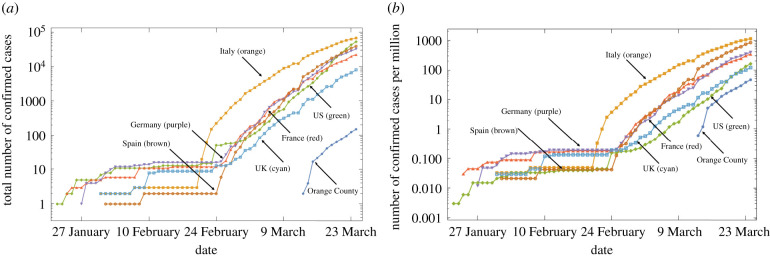
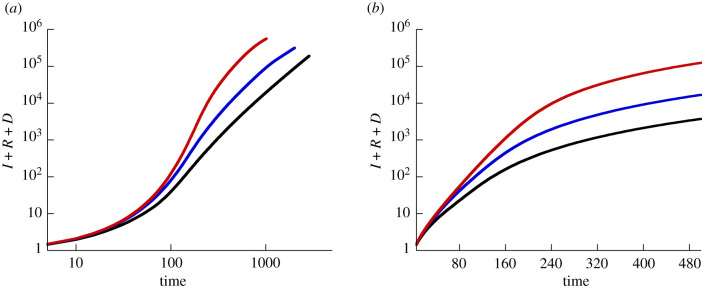
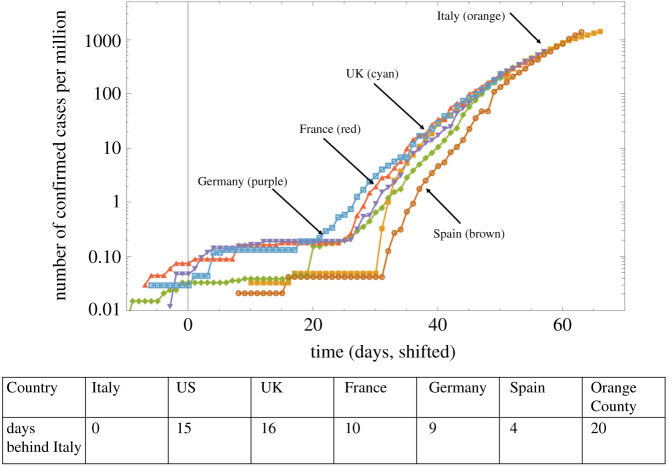
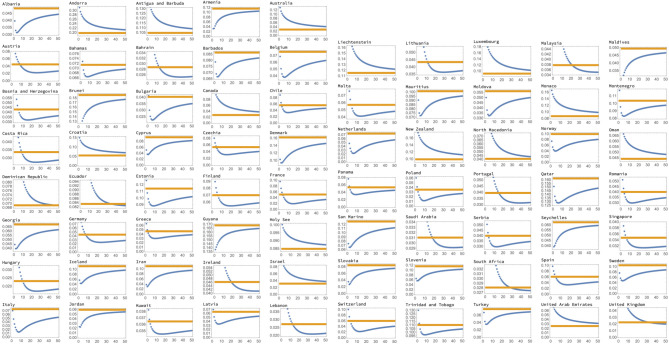
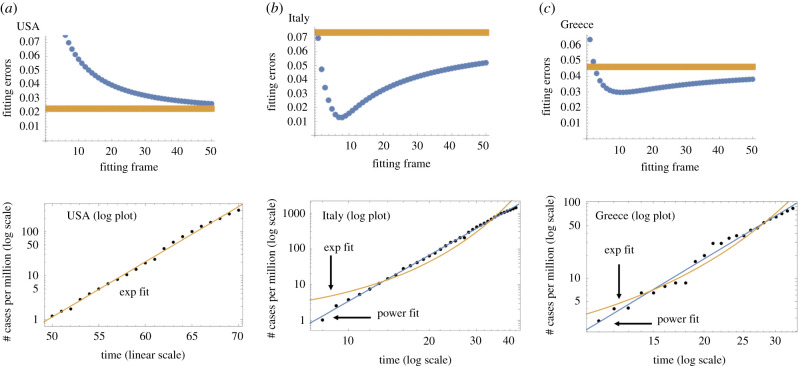
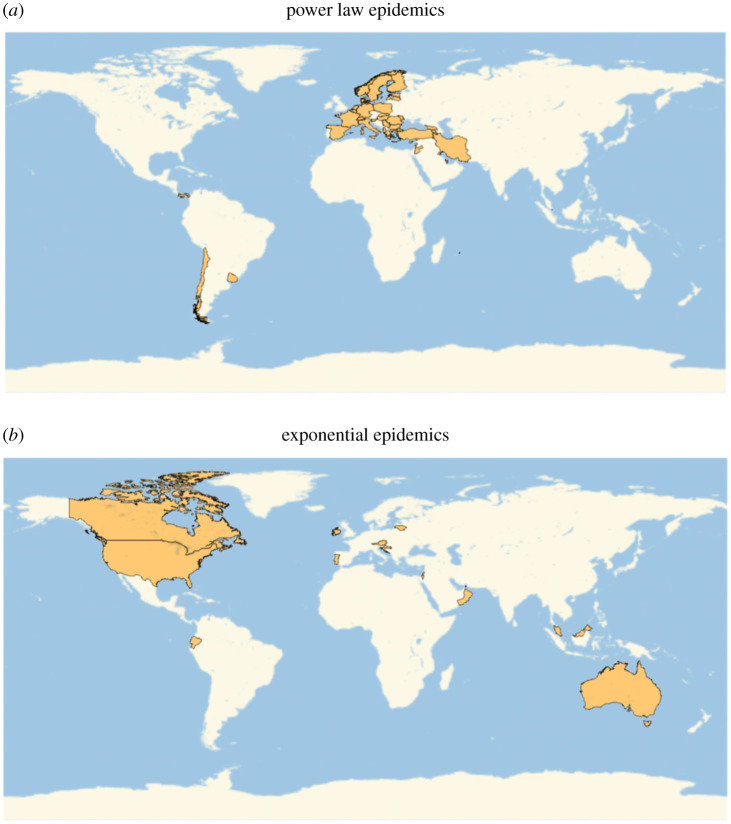
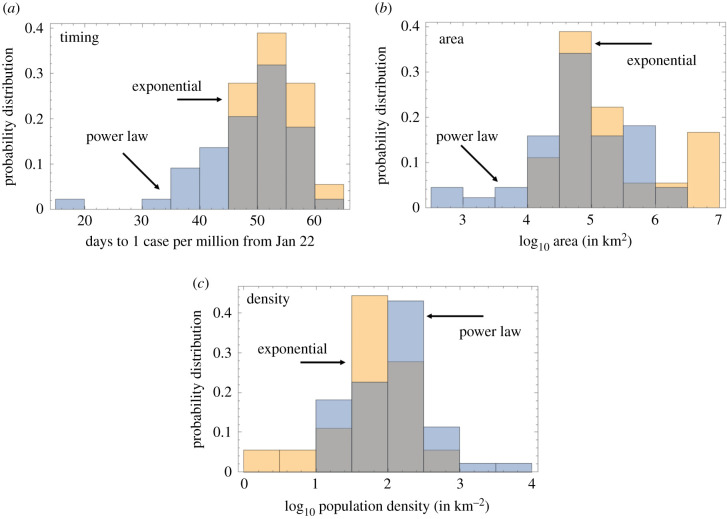
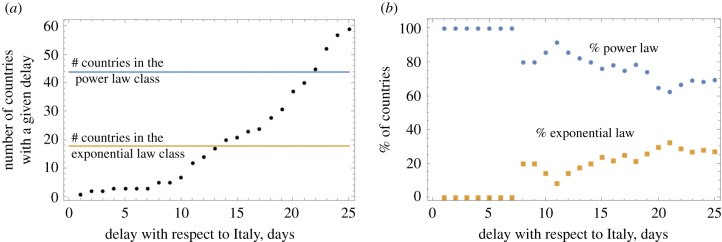
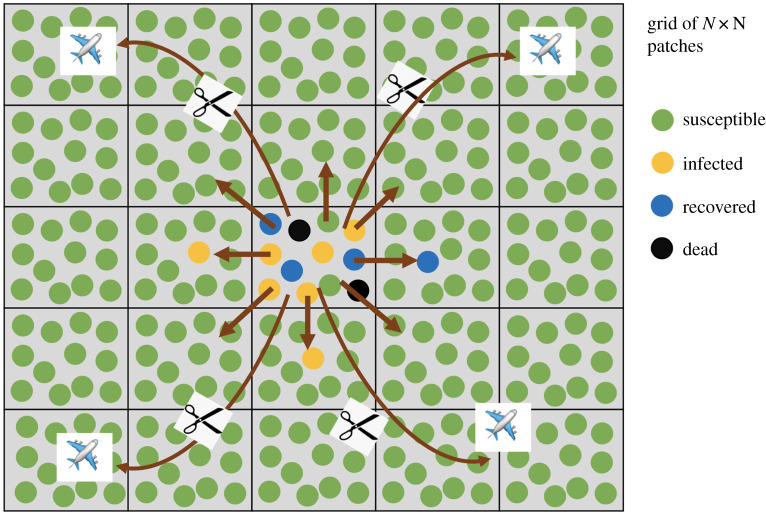
We have analysed the COVID-19 epidemic data of more than 174 countries (excluding China) in the period between 22 January and 28 March 2020. We found that some countries (such as the USA, the UK and Canada) follow an exponential epidemic growth, while others (like Italy and several other European countries) show a power law like growth. Regardless of the best fitting law, many countries can be shown to follow a common trajectory that is similar to Italy (the epicentre at the time of analysis), but with varying degrees of delay. We found that countries with 'younger' epidemics, i.e. countries where the epidemic started more recently, tend to exhibit more exponential like behaviour, while countries that were closer behind Italy tend to follow a power law growth. We hypothesize that there is a universal growth pattern of this infection that starts off as exponential and subsequently becomes more power law like. Although it cannot be excluded that this growth pattern is a consequence of social distancing measures, an alternative explanation is that it is an intrinsic epidemic growth law, dictated by a spatially distributed community structure, where the growth in individual highly mixed communities is exponential but the longer term, local geographical spread (in the absence of global mixing) results in a power law. This is supported by computer simulations of a metapopulation model that gives rise to predictions about the growth dynamics that are consistent with correlations found in the epidemiological data. Therefore, seeing a deviation from straight exponential growth may be a natural progression of the epidemic in each country. On the practical side, this indicates that (i) even in the absence of strict social distancing interventions, exponential growth is not an accurate predictor of longer term infection spread, and (ii) a deviation from exponential spread and a reduction of estimated doubling times do not necessarily indicate successful interventions, which are instead indicated by a transition to a reduced power or by a deviation from power law behaviour.
我们分析了 2020 年 1 月 22 日至 3 月 28 日期间 174 个国家(不包括中国)的 COVID-19 疫情数据。我们发现,一些国家(如美国、英国和加拿大)的疫情呈指数级增长,而另一些国家(如意大利和其他几个欧洲国家)则呈幂律增长。无论最佳拟合定律如何,许多国家都可以表现出与意大利(分析时的震中)相似的共同轨迹,但延迟程度不同。我们发现,那些疫情相对较新的国家,即疫情开始时间较晚的国家,往往表现出更类似于指数的行为,而那些紧随意大利之后的国家则倾向于遵循幂律增长。我们假设这种感染存在一种普遍的增长模式,它开始是指数级的,随后变得更类似于幂律。虽然不能排除这种增长模式是社会隔离措施的结果,但另一种解释是,这是一种内在的疫情增长规律,由空间分布的社区结构决定,在这种结构中,个体高度混合的社区的增长是指数级的,但从长期来看,局部地理传播(在没有全球混合的情况下)会导致幂律。这得到了元种群模型计算机模拟的支持,该模型产生了与流行病学数据中发现的相关性一致的关于增长动态的预测。因此,看到偏离直线指数增长可能是每个国家疫情的自然发展。从实际角度来看,这表明:(i)即使没有严格的社会隔离干预,指数增长也不是长期感染传播的准确预测指标;(ii)偏离指数传播和估计倍增时间的减少并不一定表明干预措施成功,而是表明向减少的幂律或偏离幂律行为的转变。