• 文献检索
  • 文档翻译
  • 深度研究
  • 学术资讯
  • Suppr Zotero 插件Zotero 插件
  • 邀请有礼
  • 套餐&价格
  • 历史记录
应用&插件
Suppr Zotero 插件Zotero 插件浏览器插件Mac 客户端Windows 客户端微信小程序
定价
高级版会员购买积分包购买API积分包
服务
文献检索文档翻译深度研究API 文档MCP 服务
关于我们
关于 Suppr公司介绍联系我们用户协议隐私条款
关注我们

Suppr 超能文献

核心技术专利:CN118964589B侵权必究
粤ICP备2023148730 号-1Suppr @ 2026

文献检索

告别复杂PubMed语法,用中文像聊天一样搜索,搜遍4000万医学文献。AI智能推荐,让科研检索更轻松。

立即免费搜索

文件翻译

保留排版,准确专业,支持PDF/Word/PPT等文件格式,支持 12+语言互译。

免费翻译文档

深度研究

AI帮你快速写综述,25分钟生成高质量综述,智能提取关键信息,辅助科研写作。

立即免费体验

2017 年全球饮食数据库:来自全球 1220 项调查的 560 万儿童和成年人对 54 种主要食物、饮料和营养素的数据提供情况和差距。

Global Dietary Database 2017: data availability and gaps on 54 major foods, beverages and nutrients among 5.6 million children and adults from 1220 surveys worldwide.

机构信息

Friedman School of Nutrition Science and Policy, Tufts University, Boston, Massachusetts, USA

Friedman School of Nutrition Science and Policy, Tufts University, Boston, Massachusetts, USA.

出版信息

BMJ Glob Health. 2021 Feb;6(2). doi: 10.1136/bmjgh-2020-003585.

DOI:10.1136/bmjgh-2020-003585
PMID:33547175
原文链接:https://pmc.ncbi.nlm.nih.gov/articles/PMC7871251/
Abstract

BACKGROUND

We aimed to systematically identify, standardise and disseminate individual-level dietary intake surveys from up to 207 countries for 54 foods, beverages and nutrients, including subnational intakes by age, sex, education and urban/rural residence, from 1980 to 2015.

METHODS

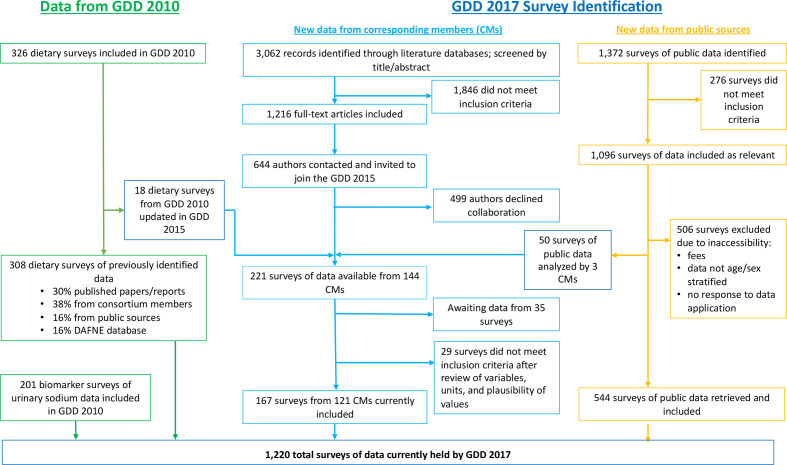
Between 2008-2011 and 2014-2020, the Global Dietary Database (GDD) project systematically searched for surveys assessing individual-level intake worldwide. We prioritised nationally or subnationally representative surveys using 24-hour recalls, Food-Frequency Questionnaires or short standardised questionnaires. Data were retrieved from websites or corresponding members as individual-level food group microdata or aggregate stratum-level data. Standardisation included quality assessment; data cleaning; categorising of foods and nutrients and their units; aggregation by demographic strata and energy adjustment.

RESULTS

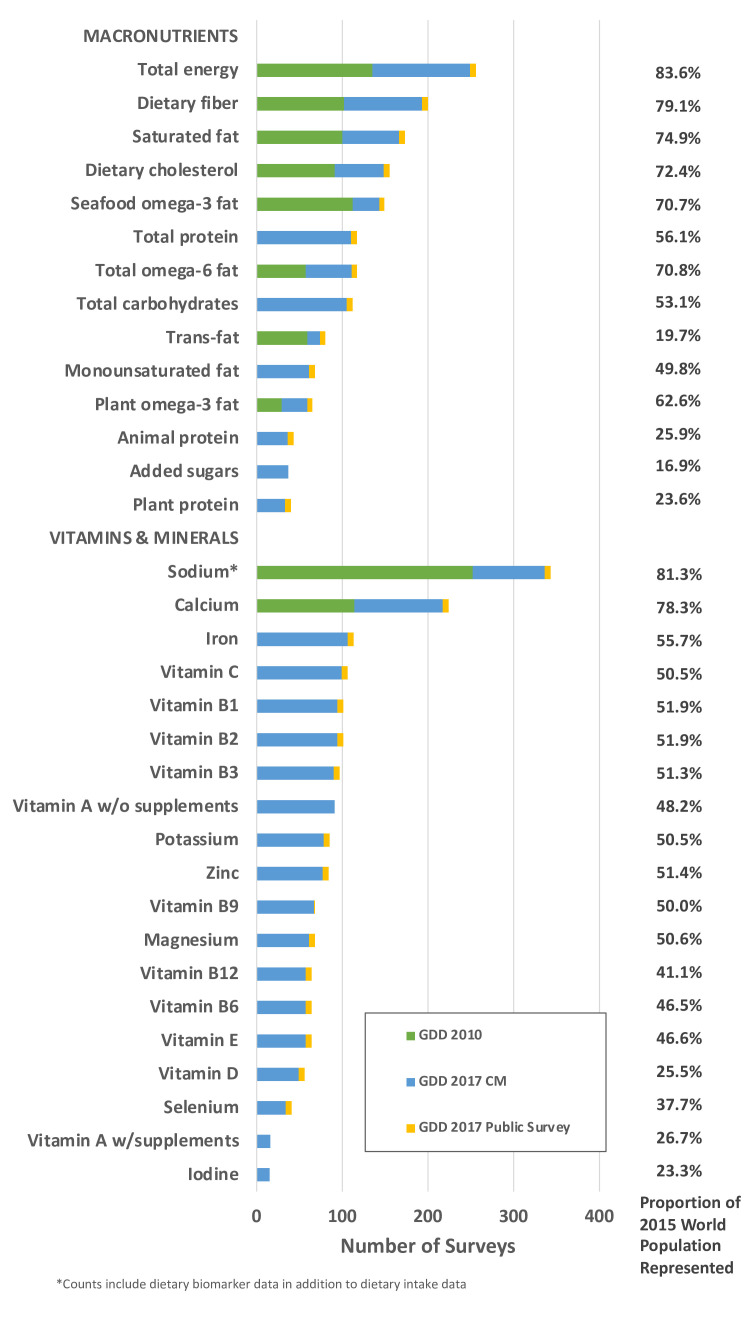
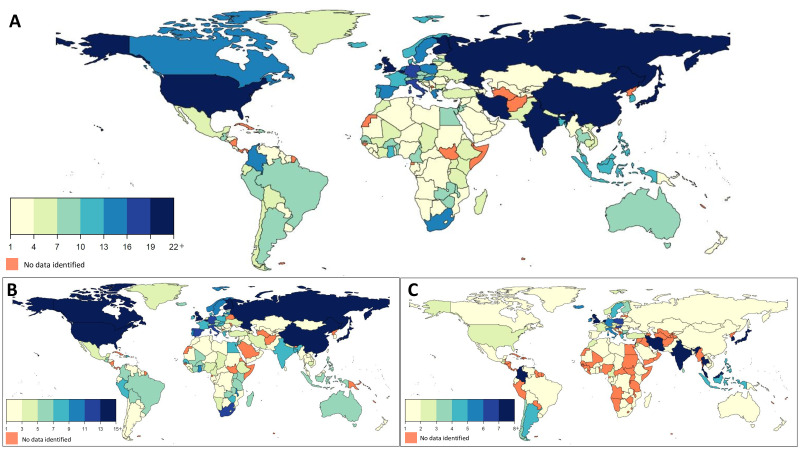
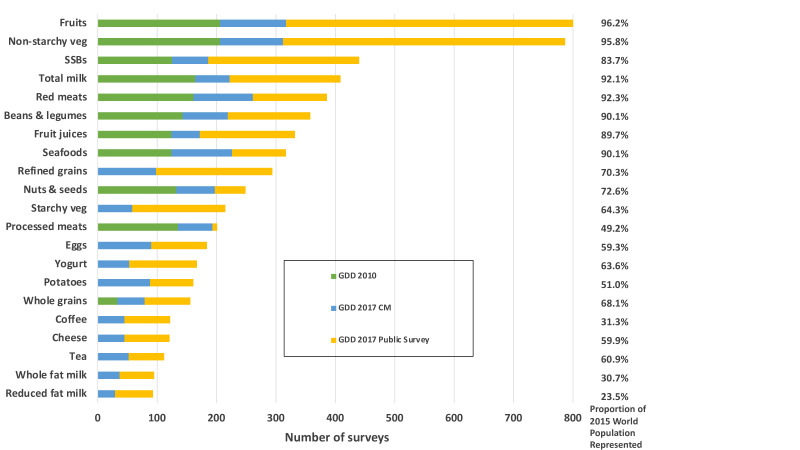
We standardised and incorporated 1220 surveys into the final GDD 2017 database, together represented 188 countries and 99.0% of the world's population in 2015. 72.1% were nationally, 17.0% subnationally, and 10.9% community-level representative. 41.2% used Food-Frequency Questionnaires; 23.4%, 24-hour recalls; 15.8%, Demographic Health Survey questionnaires; 13.1%, biomarkers and 6.4%, household surveys. 73.9% of surveys included data on children; 52.2%, by urban and rural residence; and 30.2%, by education. Most surveys were in high-income countries, followed by sub-Saharan Africa and Asia. Most commonly ascertained foods were fruits (N=803 surveys), non-starchy vegetables (N=787) and sugar-sweetened beverages (N=440); and nutrients, sodium (N=343), energy (N=256), calcium (N=224) and fibre (N=200). Least available data were on iodine, vitamin A, plant protein, selenium, added sugar and animal protein.

CONCLUSIONS

This systematic search, retrieval and standardised effort provides the most comprehensive empirical evidence on dietary intakes across and within countries worldwide.

摘要

背景

本研究旨在系统性地识别、规范并传播 1980 年至 2015 年间来自 207 个国家/地区的个体饮食摄入调查,涵盖 54 种食物、饮料和营养素,包括按年龄、性别、教育程度和城乡居住划分的亚国家/地区摄入量。

方法

2008 年至 2011 年和 2014 年至 2020 年期间,全球饮食数据库(GDD)项目系统地搜索了全球范围内评估个体摄入的调查。我们通过 24 小时回忆、食物频率问卷或简短标准化问卷优先考虑具有国家或次国家代表性的调查。从网站或相应成员处检索到个体层面食物组微观数据或汇总层数据。标准化包括质量评估、数据清理、食物和营养素的分类及其单位、按人口统计学分层和能量调整进行汇总。

结果

我们将 1220 项调查标准化并纳入最终的 GDD 2017 数据库中,这些调查共代表了 2015 年 188 个国家和全球 99.0%的人口。72.1%为国家级,17.0%为次国家级,10.9%为社区级。41.2%使用食物频率问卷;23.4%使用 24 小时回忆;15.8%使用人口健康调查问卷;13.1%使用生物标志物,6.4%使用家庭调查。73.9%的调查包括儿童数据;52.2%按城乡居住划分,30.2%按教育程度划分。大多数调查来自高收入国家,其次是撒哈拉以南非洲和亚洲。最常确定的食物是水果(803 项调查)、非淀粉蔬菜(787 项)和含糖饮料(440 项);最常确定的营养素是钠(343 项)、能量(256 项)、钙(224 项)和纤维(200 项)。碘、维生素 A、植物蛋白、硒、添加糖和动物蛋白的数据最少。

结论

这项系统性搜索、检索和标准化工作提供了全球范围内最全面的关于饮食摄入的跨国和国内实证证据。

https://cdn.ncbi.nlm.nih.gov/pmc/blobs/423b/7871251/3aacdc44dfc5/bmjgh-2020-003585f04.jpg
https://cdn.ncbi.nlm.nih.gov/pmc/blobs/423b/7871251/88f6580c2809/bmjgh-2020-003585f01.jpg
https://cdn.ncbi.nlm.nih.gov/pmc/blobs/423b/7871251/c7d9bad5f222/bmjgh-2020-003585f02.jpg
https://cdn.ncbi.nlm.nih.gov/pmc/blobs/423b/7871251/32c32acd64a5/bmjgh-2020-003585f03.jpg
https://cdn.ncbi.nlm.nih.gov/pmc/blobs/423b/7871251/3aacdc44dfc5/bmjgh-2020-003585f04.jpg

相似文献

1
Global Dietary Database 2017: data availability and gaps on 54 major foods, beverages and nutrients among 5.6 million children and adults from 1220 surveys worldwide.2017 年全球饮食数据库:来自全球 1220 项调查的 560 万儿童和成年人对 54 种主要食物、饮料和营养素的数据提供情况和差距。
BMJ Glob Health. 2021 Feb;6(2). doi: 10.1136/bmjgh-2020-003585.
2
Dietary Intake Among US Adults, 1999-2012.1999 - 2012年美国成年人的饮食摄入量
JAMA. 2016 Jun 21;315(23):2542-53. doi: 10.1001/jama.2016.7491.
3
Harmonising dietary datasets for global surveillance: methods and findings from the Global Dietary Database.全球监测的膳食数据集协调:来自全球膳食数据库的方法和结果。
Public Health Nutr. 2024 Jan 19;27(1):e47. doi: 10.1017/S1368980024000211.
4
Lunch on School Days in Canada: Examining Contributions to Nutrient and Food Group Intake and Differences across Eating Locations.加拿大上学日的午餐:探究对营养素和食物组摄入量的贡献以及不同就餐地点的差异。
J Acad Nutr Diet. 2020 Sep;120(9):1484-1497. doi: 10.1016/j.jand.2020.01.011. Epub 2020 Jun 2.
5
Reliability and Validity of Food Frequency Questions to Assess Beverage and Food Group Intakes among Low-Income 2- to 4-Year-Old Children.评估低收入 2 至 4 岁儿童饮料和食物摄入量的食物频率问卷的可靠性和有效性。
J Acad Nutr Diet. 2016 Jun;116(6):931-9. doi: 10.1016/j.jand.2016.02.014. Epub 2016 Mar 31.
6
Global, Regional, and National Consumption of Sugar-Sweetened Beverages, Fruit Juices, and Milk: A Systematic Assessment of Beverage Intake in 187 Countries.全球、区域和国家层面的含糖饮料、果汁及牛奶消费量:对187个国家饮料摄入量的系统评估
PLoS One. 2015 Aug 5;10(8):e0124845. doi: 10.1371/journal.pone.0124845. eCollection 2015.
7
Assessing dietary intakes from household budget surveys: A national analysis in Bangladesh.评估家庭预算调查中的饮食摄入量:孟加拉国的国家分析。
PLoS One. 2018 Aug 27;13(8):e0202831. doi: 10.1371/journal.pone.0202831. eCollection 2018.
8
Discretionary Foods Have a High Contribution and Fruit, Vegetables, and Legumes Have a Low Contribution to the Total Energy Intake of the Mexican Population.任意性食物对墨西哥人群总能量摄入的贡献较高,而水果、蔬菜和豆类的贡献较低。
J Nutr. 2016 Sep;146(9):1881S-7S. doi: 10.3945/jn.115.219121. Epub 2016 Aug 10.
9
Children and adolescents' choices of foods and beverages high in added sugars are associated with intakes of key nutrients and food groups.儿童和青少年对添加糖含量高的食品和饮料的选择与关键营养素和食物组的摄入量有关。
J Adolesc Health. 2004 Jan;34(1):56-63. doi: 10.1016/s1054-139x(03)00248-9.
10
Evaluating Diet Quality of Canadian Adults Using Health Canada's Surveillance Tool Tier System: Findings from the 2015 Canadian Community Health Survey-Nutrition.使用加拿大卫生部监测工具分层系统评估加拿大成年人的饮食质量:来自 2015 年加拿大社区健康调查-营养的结果。
Nutrients. 2020 Apr 16;12(4):1113. doi: 10.3390/nu12041113.

引用本文的文献

1
The development and evaluation of a quality assessment framework for reuse of dietary intake data: an FNS-Cloud study.膳食摄入数据再利用质量评估框架的开发与评估:一项FNS-Cloud研究
Front Nutr. 2025 Jun 6;12:1519401. doi: 10.3389/fnut.2025.1519401. eCollection 2025.
2
Energy and Macronutrient Dietary Intakes of Serbian Adults 18-64 Years Old: EFSA EU Menu Food Consumption Survey in Serbia (2017-2022).18至64岁塞尔维亚成年人的能量和常量营养素膳食摄入量:塞尔维亚的欧洲食品安全局欧盟菜单食品消费调查(2017 - 2022年)
Foods. 2025 Mar 31;14(7):1228. doi: 10.3390/foods14071228.
3
A comparison of development methods used to define portion sizes in food-based dietary guidelines around the world.

本文引用的文献

1
Global Improvement in Dietary Quality Could Lead to Substantial Reduction in Premature Death.全球饮食质量的改善可能导致过早死亡人数的大量减少。
J Nutr. 2019 Jun 1;149(6):1065-1074. doi: 10.1093/jn/nxz010.
2
Health effects of dietary risks in 195 countries, 1990-2017: a systematic analysis for the Global Burden of Disease Study 2017.195 个国家 1990 年至 2017 年饮食风险对健康的影响:2017 年全球疾病负担研究的系统分析。
Lancet. 2019 May 11;393(10184):1958-1972. doi: 10.1016/S0140-6736(19)30041-8. Epub 2019 Apr 4.
3
Global, regional, and national comparative risk assessment of 84 behavioural, environmental and occupational, and metabolic risks or clusters of risks for 195 countries and territories, 1990-2017: a systematic analysis for the Global Burden of Disease Study 2017.
世界各地基于食物的膳食指南中用于定义食物份量的制定方法比较。
Front Nutr. 2025 Feb 12;12:1532926. doi: 10.3389/fnut.2025.1532926. eCollection 2025.
4
Temporal trends in the planetary health diet index and its association with cardiovascular, kidney, and metabolic diseases: A comprehensive analysis from global and individual perspectives.全球健康饮食指数的时间趋势及其与心血管、肾脏和代谢疾病的关联:基于全球和个体视角的综合分析
J Nutr Health Aging. 2025 May;29(5):100520. doi: 10.1016/j.jnha.2025.100520. Epub 2025 Feb 21.
5
Burdens of type 2 diabetes and cardiovascular disease attributable to sugar-sweetened beverages in 184 countries.184个国家中由含糖饮料导致的2型糖尿病和心血管疾病负担
Nat Med. 2025 Feb;31(2):552-564. doi: 10.1038/s41591-024-03345-4. Epub 2025 Jan 6.
6
Global adherence to a healthy and sustainable diet and potential reduction in premature death.全球对健康可持续饮食的依从性及过早死亡潜在减少情况。
Proc Natl Acad Sci U S A. 2024 Dec 10;121(50):e2319008121. doi: 10.1073/pnas.2319008121. Epub 2024 Dec 2.
7
Global estimation of dietary micronutrient inadequacies: a modelling analysis.全球膳食微量营养素不足估计:建模分析。
Lancet Glob Health. 2024 Oct;12(10):e1590-e1599. doi: 10.1016/S2214-109X(24)00276-6. Epub 2024 Aug 29.
8
Intake of sugar sweetened beverages among children and adolescents in 185 countries between 1990 and 2018: population based study.1990 年至 2018 年 185 个国家儿童和青少年摄入含糖饮料情况:基于人群的研究。
BMJ. 2024 Aug 7;386:e079234. doi: 10.1136/bmj-2024-079234.
9
FoodEx2 Harmonization of the Food Consumption Database from the Italian IV SCAI Children's Survey.FoodEx2 对意大利 IV SCAI 儿童调查中食物消费数据库的协调。
Nutrients. 2024 Apr 5;16(7):1065. doi: 10.3390/nu16071065.
10
Exploring Diet and Nutrient Insufficiencies across Age Groups: Insights from a Population-Based Study of Brazilian Adults.探索不同年龄组的饮食和营养不足:基于巴西成年人的一项人群研究的见解。
Nutrients. 2024 Mar 5;16(5):750. doi: 10.3390/nu16050750.
全球、区域和国家 84 种行为、环境、职业和代谢风险以及 195 个国家和地区 1990 至 2017 年风险簇的比较风险评估:全球疾病负担研究 2017 系统分析。
Lancet. 2018 Nov 10;392(10159):1923-1994. doi: 10.1016/S0140-6736(18)32225-6. Epub 2018 Nov 8.
4
Dietary assessment toolkits: an overview.膳食评估工具包:概述。
Public Health Nutr. 2019 Mar;22(3):404-418. doi: 10.1017/S1368980018002951. Epub 2018 Nov 15.
5
The Global Nutrient Database: availability of macronutrients and micronutrients in 195 countries from 1980 to 2013.全球营养数据库:1980 年至 2013 年 195 个国家的宏量营养素和微量营养素供应情况。
Lancet Planet Health. 2018 Aug;2(8):e353-e368. doi: 10.1016/S2542-5196(18)30170-0.
6
Global Dietary Surveillance: Data Gaps and Challenges.全球饮食监测:数据缺口与挑战
Food Nutr Bull. 2018 Jun;39(2):175-205. doi: 10.1177/0379572117752986. Epub 2018 Feb 25.
7
Etiologic effects and optimal intakes of foods and nutrients for risk of cardiovascular diseases and diabetes: Systematic reviews and meta-analyses from the Nutrition and Chronic Diseases Expert Group (NutriCoDE).食物和营养素对心血管疾病及糖尿病风险的病因学影响与最佳摄入量:营养与慢性病专家组(NutriCoDE)的系统评价和荟萃分析
PLoS One. 2017 Apr 27;12(4):e0175149. doi: 10.1371/journal.pone.0175149. eCollection 2017.
8
Alignment of Healthy Dietary Patterns and Environmental Sustainability: A Systematic Review.健康饮食模式与环境可持续性的一致性:一项系统综述。
Adv Nutr. 2016 Nov 15;7(6):1005-1025. doi: 10.3945/an.116.012567. Print 2016 Nov.
9
A global database of food and nutrient consumption.一个全球食物与营养消费数据库。
Bull World Health Organ. 2016 Dec 1;94(12):931-934. doi: 10.2471/BLT.15.156323. Epub 2016 Sep 16.
10
Global Expanded Nutrient Supply (GENuS) Model: A New Method for Estimating the Global Dietary Supply of Nutrients.全球扩展营养供应(GENuS)模型:一种估算全球营养素膳食供应量的新方法。
PLoS One. 2016 Jan 25;11(1):e0146976. doi: 10.1371/journal.pone.0146976. eCollection 2016.