• 文献检索
  • 文档翻译
  • 深度研究
  • 学术资讯
  • Suppr Zotero 插件Zotero 插件
  • 邀请有礼
  • 套餐&价格
  • 历史记录
应用&插件
Suppr Zotero 插件Zotero 插件浏览器插件Mac 客户端Windows 客户端微信小程序
定价
高级版会员购买积分包购买API积分包
服务
文献检索文档翻译深度研究API 文档MCP 服务
关于我们
关于 Suppr公司介绍联系我们用户协议隐私条款
关注我们

Suppr 超能文献

核心技术专利:CN118964589B侵权必究
粤ICP备2023148730 号-1Suppr @ 2026

文献检索

告别复杂PubMed语法,用中文像聊天一样搜索,搜遍4000万医学文献。AI智能推荐,让科研检索更轻松。

立即免费搜索

文件翻译

保留排版,准确专业,支持PDF/Word/PPT等文件格式,支持 12+语言互译。

免费翻译文档

深度研究

AI帮你快速写综述,25分钟生成高质量综述,智能提取关键信息,辅助科研写作。

立即免费体验

利用回顾性分析对中国大陆 COVID-19 的精细时空聚集性检测。

Fine-Scale Space-Time Cluster Detection of COVID-19 in Mainland China Using Retrospective Analysis.

机构信息

State Key Laboratory of Remote Sensing Science, Aerospace Information Research Institute, Chinese Academy of Sciences, Beijing 100101, China.

School of Geography, Geomatics and Planning, Jiangsu Normal University, Xuzhou 221116, China.

出版信息

Int J Environ Res Public Health. 2021 Mar 30;18(7):3583. doi: 10.3390/ijerph18073583.

DOI:10.3390/ijerph18073583
PMID:33808290
原文链接:https://pmc.ncbi.nlm.nih.gov/articles/PMC8037204/
Abstract

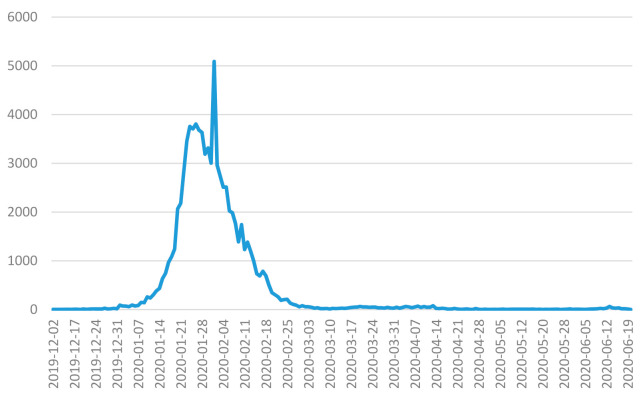
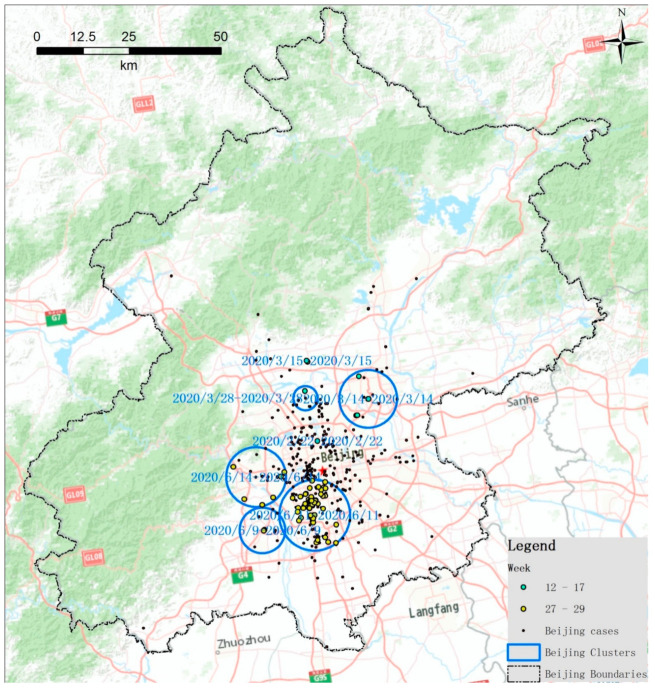
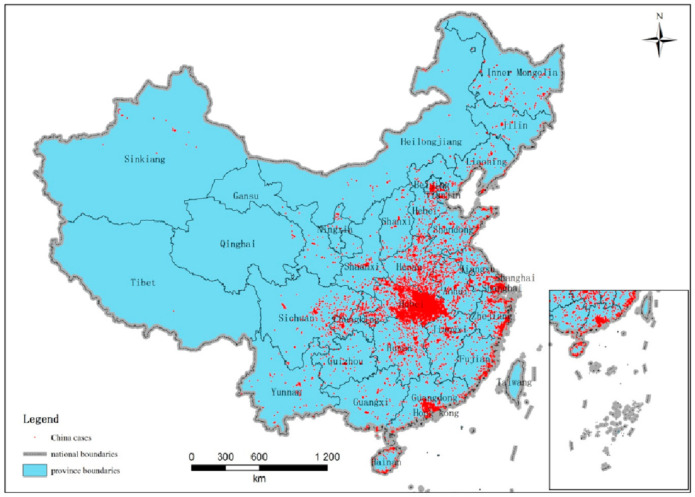
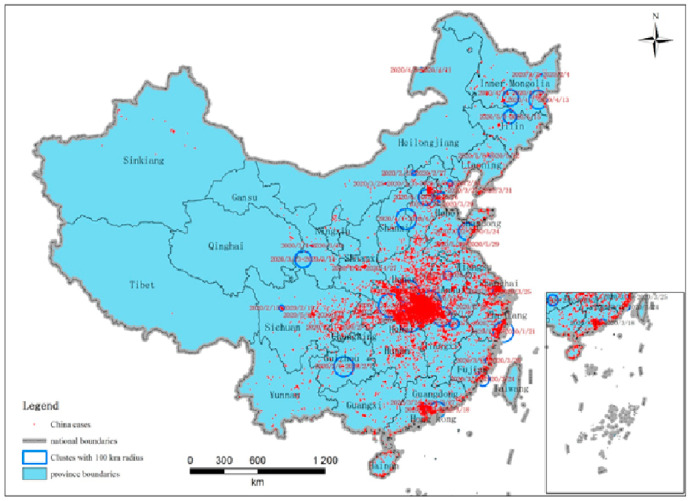
Exploring spatio-temporal patterns of disease incidence can help to identify areas of significantly elevated or decreased risk, providing potential etiologic clues. The study uses the retrospective analysis of space-time scan statistic to detect the clusters of COVID-19 in mainland China with a different maximum clustering radius at the family-level based on case dates of onset. The results show that the detected clusters vary with the clustering radius. Forty-three space-time clusters were detected with a maximum clustering radius of 100 km and 88 clusters with a maximum clustering radius of 10 km from 2 December 2019 to 20 June 2020. Using a smaller clustering radius may identify finer clusters. Hubei has the most clusters regardless of scale. In addition, most of the clusters were generated in February. That indicates China's COVID-19 epidemic prevention and control strategy is effective, and they have successfully prevented the virus from spreading from Hubei to other provinces over time. Well-developed provinces or cities, which have larger populations and developed transportation networks, are more likely to generate space-time clusters. The analysis based on the data of cases from onset may detect the start times of clusters seven days earlier than similar research based on diagnosis dates. Our analysis of space-time clustering based on the data of cases on the family-level can be reproduced in other countries that are still seriously affected by the epidemic such as the USA, India, and Brazil, thus providing them with more precise signals of clustering.

摘要

探索疾病发病率的时空模式有助于识别风险显著升高或降低的区域,提供潜在的病因线索。本研究使用时空扫描统计的回顾性分析,基于发病日期,以家庭为单位,在中国大陆检测不同最大聚类半径的 COVID-19 聚类。结果表明,检测到的聚类随聚类半径而变化。从 2019 年 12 月 2 日至 2020 年 6 月 20 日,最大聚类半径为 100km 时检测到 43 个时空聚类,最大聚类半径为 10km 时检测到 88 个聚类。使用较小的聚类半径可能会识别出更精细的聚类。无论规模大小,湖北的聚类数量最多。此外,大多数聚类发生在 2 月。这表明中国的 COVID-19 疫情防控策略是有效的,随着时间的推移,他们成功地阻止了病毒从湖北传播到其他省份。人口较多、交通网络发达的发达省份或城市更容易产生时空聚类。基于发病日期的病例数据进行的分析比基于诊断日期的类似研究更早地检测到聚类的开始时间,可提前七天。我们基于家庭级病例数据的时空聚类分析可以在其他仍受疫情严重影响的国家(如美国、印度和巴西)重现,从而为它们提供更精确的聚类信号。

https://cdn.ncbi.nlm.nih.gov/pmc/blobs/3abe/8037204/e19e7f460dbf/ijerph-18-03583-g006.jpg
https://cdn.ncbi.nlm.nih.gov/pmc/blobs/3abe/8037204/14cdc626ea53/ijerph-18-03583-g001.jpg
https://cdn.ncbi.nlm.nih.gov/pmc/blobs/3abe/8037204/6b83bfda8b6c/ijerph-18-03583-g002.jpg
https://cdn.ncbi.nlm.nih.gov/pmc/blobs/3abe/8037204/09d2dea29fb6/ijerph-18-03583-g003.jpg
https://cdn.ncbi.nlm.nih.gov/pmc/blobs/3abe/8037204/34d94c3d7274/ijerph-18-03583-g004.jpg
https://cdn.ncbi.nlm.nih.gov/pmc/blobs/3abe/8037204/1c9dd438e421/ijerph-18-03583-g005.jpg
https://cdn.ncbi.nlm.nih.gov/pmc/blobs/3abe/8037204/e19e7f460dbf/ijerph-18-03583-g006.jpg

相似文献

1
Fine-Scale Space-Time Cluster Detection of COVID-19 in Mainland China Using Retrospective Analysis.利用回顾性分析对中国大陆 COVID-19 的精细时空聚集性检测。
Int J Environ Res Public Health. 2021 Mar 30;18(7):3583. doi: 10.3390/ijerph18073583.
2
Spatio-temporal distribution characteristics of COVID-19 in China: a city-level modeling study.中国新冠肺炎的时空分布特征:一项城市层面的建模研究
BMC Infect Dis. 2021 Aug 14;21(1):816. doi: 10.1186/s12879-021-06515-8.
3
Analysis on the characteristics of spatio-temporal evolution and aggregation trend of early COVID-19 in mainland China.中国大陆新冠肺炎时空演变特征及聚集趋势分析。
Sci Rep. 2022 Mar 14;12(1):4380. doi: 10.1038/s41598-022-08403-w.
4
Spatiotemporal cluster analysis of COVID-19 and its relationship with environmental factors at the city level in mainland China.中国大陆城市层面 COVID-19 的时空聚集分析及其与环境因素的关系。
Environ Sci Pollut Res Int. 2022 Feb;29(9):13386-13395. doi: 10.1007/s11356-021-16600-9. Epub 2021 Sep 30.
5
An analysis of the domestic resumption of social production and life under the COVID-19 epidemic.对 COVID-19 疫情下国内社会生产生活恢复情况的分析。
PLoS One. 2020 Jul 22;15(7):e0236387. doi: 10.1371/journal.pone.0236387. eCollection 2020.
6
Spatial and temporal clustering analysis of tuberculosis in the mainland of China at the prefecture level, 2005-2015.2005-2015 年中国大陆省级地区结核病时空聚类分析。
Infect Dis Poverty. 2018 Oct 20;7(1):106. doi: 10.1186/s40249-018-0490-8.
7
[Epidemiological analysis on 1 052 cases of COVID-19 in epidemic clusters].[1052例聚集性疫情新冠肺炎病例的流行病学分析]
Zhonghua Liu Xing Bing Xue Za Zhi. 2020 Jul 10;41(7):1004-1008. doi: 10.3760/cma.j.cn112338-20200301-00223.
8
Analysis of spatial-temporal dynamic distribution and related factors of tuberculosis in China from 2008 to 2018.分析 2008 年至 2018 年中国结核病的时空动态分布及相关因素。
Sci Rep. 2023 Mar 27;13(1):4974. doi: 10.1038/s41598-023-31430-0.
9
Analysis on spatial-temporal distribution characteristics of smear positive pulmonary tuberculosis in China, 2004-2015.2004-2015 年中国涂阳肺结核空间-时间分布特征分析。
Int J Infect Dis. 2019 Mar;80S:S36-S44. doi: 10.1016/j.ijid.2019.02.038. Epub 2019 Feb 27.
10
Applying Spatio-temporal Scan Statistics and Spatial Autocorrelation Statistics to identify Covid-19 clusters in the world - A Vaccination Strategy?运用时空扫描统计和空间自相关统计来识别全球新冠病毒集群 - 一种疫苗接种策略?
Spat Spatiotemporal Epidemiol. 2021 Nov;39:100461. doi: 10.1016/j.sste.2021.100461. Epub 2021 Oct 25.

引用本文的文献

1
Exploring the Spatial Relative Risk of COVID-19 in Berlin-Neukölln.探索柏林-诺伊科伦的 COVID-19 空间相对风险。
Int J Environ Res Public Health. 2023 May 16;20(10):5830. doi: 10.3390/ijerph20105830.
2
Monitoring European data with prospective space-time scan statistics: predicting and evaluating emerging clusters of COVID-19 in European countries.利用前瞻性时空扫描统计监测欧洲数据:预测和评估欧洲国家 COVID-19 新出现的集群。
BMC Public Health. 2022 Nov 25;22(1):2183. doi: 10.1186/s12889-022-14298-z.
3
Small-scale spatiotemporal epidemiology of notifiable infectious diseases in China: a systematic review.

本文引用的文献

1
Application of Geographic Information System in Monitoring and Detecting the COVID-19 Outbreak.地理信息系统在监测和检测新冠疫情中的应用
Iran J Public Health. 2020 Oct;49(Suppl 1):114-116. doi: 10.18502/ijph.v49iS1.3679.
2
Modelling and predicting the spatio-temporal spread of cOVID-19 in Italy.建模并预测 COVID-19 在意大利的时空传播。
BMC Infect Dis. 2020 Sep 23;20(1):700. doi: 10.1186/s12879-020-05415-7.
3
A data-driven understanding of COVID-19 dynamics using sequential genetic algorithm based probabilistic cellular automata.
中国法定传染病的小尺度时空流行病学:系统综述。
BMC Infect Dis. 2022 Sep 5;22(1):723. doi: 10.1186/s12879-022-07669-9.
4
Methods Used in the Spatial and Spatiotemporal Analysis of COVID-19 Epidemiology: A Systematic Review.用于 COVID-19 流行病学的空间和时空分析的方法:系统评价。
Int J Environ Res Public Health. 2022 Jul 6;19(14):8267. doi: 10.3390/ijerph19148267.
5
Investigating Linkages Between Spatiotemporal Patterns of the COVID-19 Delta Variant and Public Health Interventions in Southeast Asia: Prospective Space-Time Scan Statistical Analysis Method.调查 COVID-19 德尔塔变异株时空模式与东南亚公共卫生干预措施之间的关联:前瞻性时空扫描统计分析方法。
JMIR Public Health Surveill. 2022 Aug 9;8(8):e35840. doi: 10.2196/35840.
6
Spatiotemporal clustering patterns and sociodemographic determinants of COVID-19 (SARS-CoV-2) infections in Helsinki, Finland.芬兰赫尔辛基 COVID-19(SARS-CoV-2)感染的时空聚集模式及社会人口学决定因素。
Spat Spatiotemporal Epidemiol. 2022 Jun;41:100493. doi: 10.1016/j.sste.2022.100493. Epub 2022 Feb 5.
7
Evolution of Responses to COVID-19 and Epidemiological Characteristics in South Korea.韩国对 COVID-19 的反应和流行病学特征的演变。
Int J Environ Res Public Health. 2022 Mar 29;19(7):4056. doi: 10.3390/ijerph19074056.
8
Panel Associations Between Newly Dead, Healed, Recovered, and Confirmed Cases During COVID-19 Pandemic.新冠肺炎大流行期间新死亡、已治愈、已恢复和已确诊病例的面板关联。
J Epidemiol Glob Health. 2022 Mar;12(1):40-55. doi: 10.1007/s44197-021-00019-z. Epub 2021 Dec 11.
使用基于序列遗传算法的概率细胞自动机对新冠病毒疾病动态进行数据驱动的理解。
Appl Soft Comput. 2020 Nov;96:106692. doi: 10.1016/j.asoc.2020.106692. Epub 2020 Aug 29.
4
SEIR modeling of the COVID-19 and its dynamics.COVID-19的SEIR模型及其动态变化
Nonlinear Dyn. 2020;101(3):1667-1680. doi: 10.1007/s11071-020-05743-y. Epub 2020 Jun 18.
5
Spatial analysis of COVID-19 clusters and contextual factors in New York City.纽约市新冠疫情聚集性病例及相关背景因素的空间分析
Spat Spatiotemporal Epidemiol. 2020 Aug;34:100355. doi: 10.1016/j.sste.2020.100355. Epub 2020 Jun 21.
6
Daily surveillance of COVID-19 using the prospective space-time scan statistic in the United States.在美国使用前瞻性时空扫描统计量对新冠病毒病进行每日监测。
Spat Spatiotemporal Epidemiol. 2020 Aug;34:100354. doi: 10.1016/j.sste.2020.100354. Epub 2020 Jun 27.
7
Effects of meteorological conditions and air pollution on COVID-19 transmission: Evidence from 219 Chinese cities.气象条件和空气污染对新冠病毒传播的影响:来自 219 个中国城市的证据。
Sci Total Environ. 2020 Nov 1;741:140244. doi: 10.1016/j.scitotenv.2020.140244. Epub 2020 Jun 15.
8
Association of particulate matter pollution and case fatality rate of COVID-19 in 49 Chinese cities.中国 49 个城市中颗粒物污染与 COVID-19 病死率的关系。
Sci Total Environ. 2020 Nov 1;741:140396. doi: 10.1016/j.scitotenv.2020.140396. Epub 2020 Jun 20.
9
Spatial analysis and GIS in the study of COVID-19. A review.空间分析和 GIS 在 COVID-19 研究中的应用。综述。
Sci Total Environ. 2020 Oct 15;739:140033. doi: 10.1016/j.scitotenv.2020.140033. Epub 2020 Jun 8.
10
Effects of temperature variation and humidity on the death of COVID-19 in Wuhan, China.温度变化和湿度对中国武汉 COVID-19 死亡的影响。
Sci Total Environ. 2020 Jul 1;724:138226. doi: 10.1016/j.scitotenv.2020.138226. Epub 2020 Mar 26.