Department of Radiation Oncology, Tohoku University Graduate School of Medicine, Sendai, Japan.
Department of Radiology, National Hospital Organization Sendai Medical Center, Sendai, Japan.
J Radiat Res. 2019 Oct 23;60(5):685-693. doi: 10.1093/jrr/rrz051.
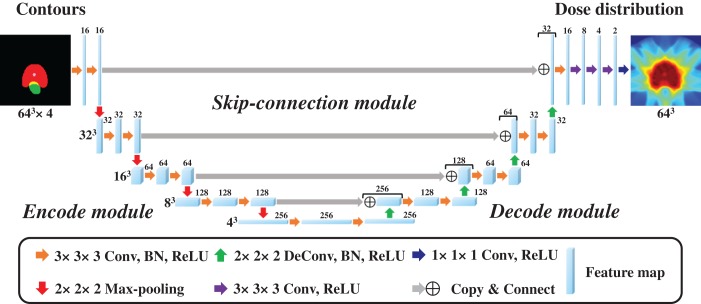
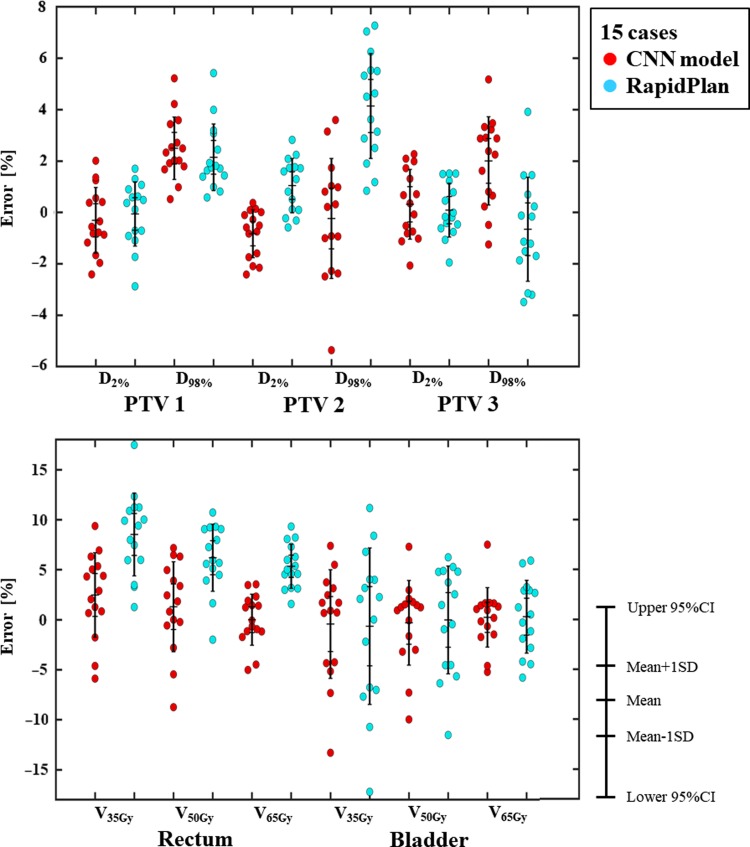
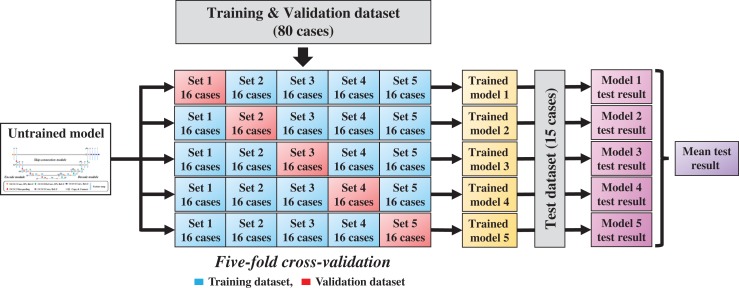
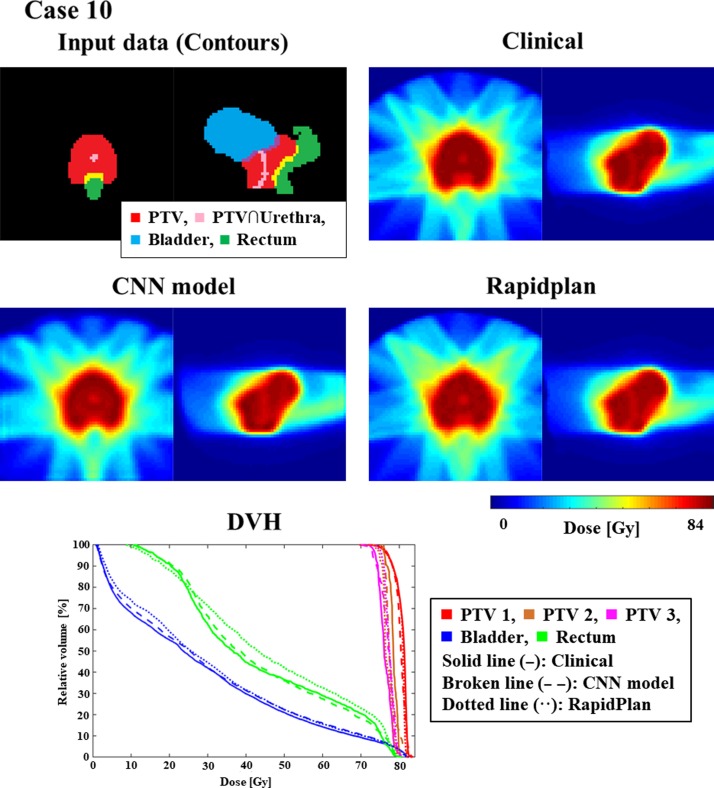
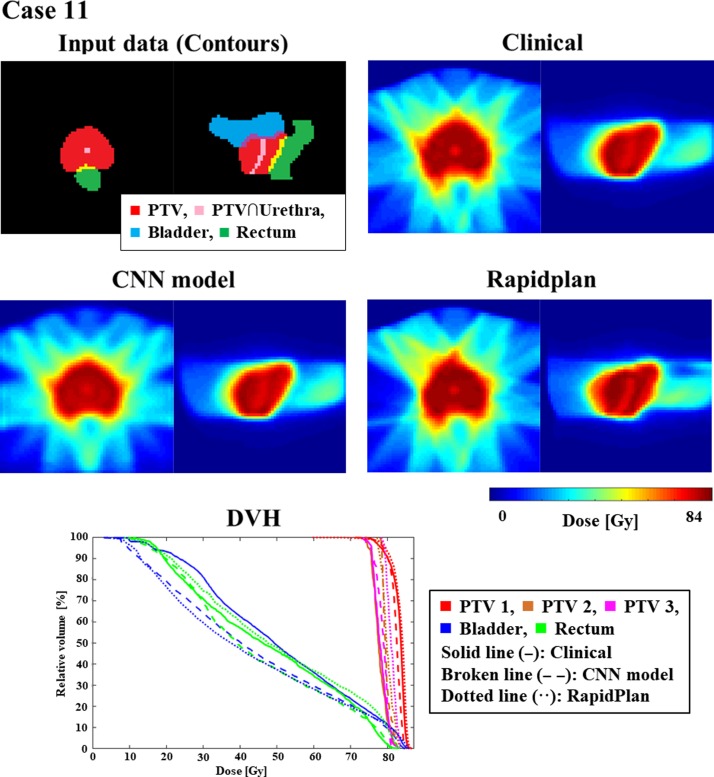
The purpose of the study was to compare a 3D convolutional neural network (CNN) with the conventional machine learning method for predicting intensity-modulated radiation therapy (IMRT) dose distribution using only contours in prostate cancer. In this study, which included 95 IMRT-treated prostate cancer patients with available dose distributions and contours for planning target volume (PTVs) and organs at risk (OARs), a supervised-learning approach was used for training, where the dose for a voxel set in the dataset was defined as the label. The adaptive moment estimation algorithm was employed for optimizing a 3D U-net similar network. Eighty cases were used for the training and validation set in 5-fold cross-validation, and the remaining 15 cases were used as the test set. The predicted dose distributions were compared with the clinical dose distributions, and the model performance was evaluated by comparison with RapidPlan™. Dose-volume histogram (DVH) parameters were calculated for each contour as evaluation indexes. The mean absolute errors (MAE) with one standard deviation (1SD) between the clinical and CNN-predicted doses were 1.10% ± 0.64%, 2.50% ± 1.17%, 2.04% ± 1.40%, and 2.08% ± 1.99% for D2, D98 in PTV-1 and V65 in rectum and V65 in bladder, respectively, whereas the MAEs with 1SD between the clinical and the RapidPlan™-generated doses were 1.01% ± 0.66%, 2.15% ± 1.25%, 5.34% ± 2.13% and 3.04% ± 1.79%, respectively. Our CNN model could predict dose distributions that were superior or comparable with that generated by RapidPlan™, suggesting the potential of CNN in dose distribution prediction.
本研究旨在比较三维卷积神经网络(CNN)与传统机器学习方法,仅使用前列腺癌的轮廓来预测调强放疗(IMRT)剂量分布。在这项研究中,包括 95 例接受 IMRT 治疗的前列腺癌患者,他们的计划靶区(PTV)和危及器官(OAR)的剂量分布和轮廓均可获得。采用有监督学习方法进行训练,其中数据集的体素集的剂量被定义为标签。采用自适应矩估计算法对 3D U-net 相似网络进行优化。80 例用于 5 折交叉验证的训练和验证集,其余 15 例用于测试集。将预测的剂量分布与临床剂量分布进行比较,并与 RapidPlan™进行比较来评估模型性能。为每个轮廓计算剂量体积直方图(DVH)参数作为评估指标。临床剂量与 CNN 预测剂量之间的平均绝对误差(MAE)及其 1 个标准差(1SD)分别为 D2、PTV-1 中的 D98 和直肠中的 V65 及膀胱中的 V65 的 1.10%±0.64%、2.50%±1.17%、2.04%±1.40%和 2.08%±1.99%,而临床剂量与 RapidPlan™生成剂量之间的 MAE 及其 1SD 分别为 1.01%±0.66%、2.15%±1.25%、5.34%±2.13%和 3.04%±1.79%。我们的 CNN 模型可以预测与 RapidPlan™生成的剂量分布相当或更好的剂量分布,这表明 CNN 在剂量分布预测方面具有潜力。