• 文献检索
  • 文档翻译
  • 深度研究
  • 学术资讯
  • Suppr Zotero 插件Zotero 插件
  • 邀请有礼
  • 套餐&价格
  • 历史记录
应用&插件
Suppr Zotero 插件Zotero 插件浏览器插件Mac 客户端Windows 客户端微信小程序
定价
高级版会员购买积分包购买API积分包
服务
文献检索文档翻译深度研究API 文档MCP 服务
关于我们
关于 Suppr公司介绍联系我们用户协议隐私条款
关注我们

Suppr 超能文献

核心技术专利:CN118964589B侵权必究
粤ICP备2023148730 号-1Suppr @ 2026

文献检索

告别复杂PubMed语法,用中文像聊天一样搜索,搜遍4000万医学文献。AI智能推荐,让科研检索更轻松。

立即免费搜索

文件翻译

保留排版,准确专业,支持PDF/Word/PPT等文件格式,支持 12+语言互译。

免费翻译文档

深度研究

AI帮你快速写综述,25分钟生成高质量综述,智能提取关键信息,辅助科研写作。

立即免费体验

估算、监测和预测 COVID-19 疫情:应用于纽约市数据的时空方法。

Estimating, monitoring, and forecasting COVID-19 epidemics: a spatiotemporal approach applied to NYC data.

机构信息

Universidade Federal de Santa Catarina, Campus Trindade, 88, Florianopolis, SC, 040-900, Brazil.

Federal University of Rio Grande do Sul, PO Box 15064, Av. Bento Gonçalves, 9500, Porto Alegre, RS, 91501-970, Brazil.

出版信息

Sci Rep. 2021 Apr 27;11(1):9089. doi: 10.1038/s41598-021-88281-w.

DOI:10.1038/s41598-021-88281-w
PMID:33907222
原文链接:https://pmc.ncbi.nlm.nih.gov/articles/PMC8079423/
Abstract

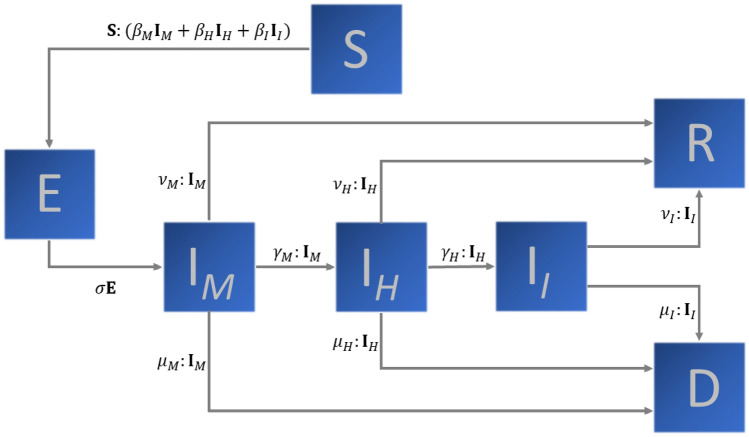
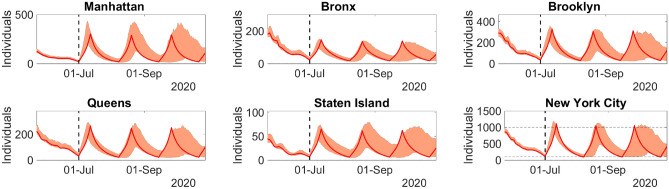
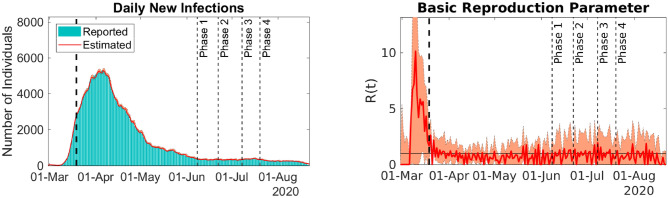
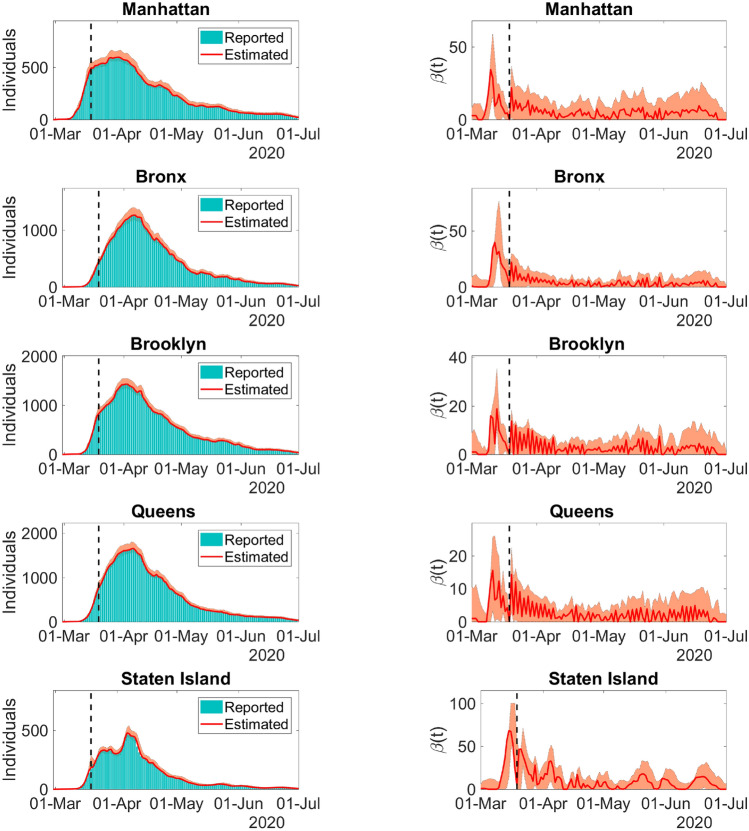
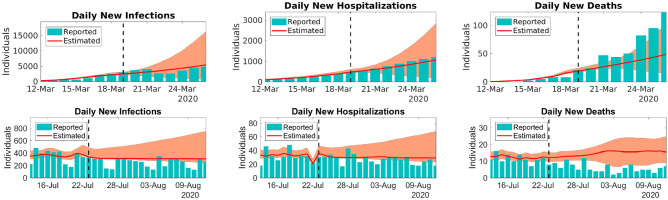
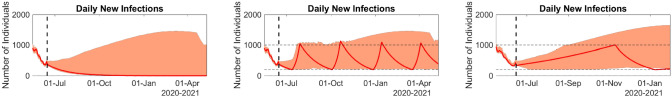
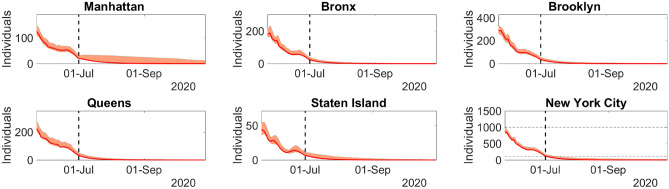
We propose a susceptible-exposed-infective-recovered-type (SEIR-type) meta-population model to simulate and monitor the (COVID-19) epidemic evolution. The basic model consists of seven categories, namely, susceptible (S), exposed (E), three infective classes, recovered (R), and deceased (D). We define these categories for n age and sex groups in m different spatial locations. Therefore, the resulting model contains all epidemiological classes for each age group, sex, and location. The mixing between them is accomplished by means of time-dependent infection rate matrices. The model is calibrated with the curve of daily new infections in New York City and its boroughs, including census data, and the proportions of infections, hospitalizations, and deaths for each age range. We finally obtain a model that matches the reported curves and predicts accurate infection information for different locations and age classes.

摘要

我们提出了一个易感-暴露-感染-恢复型(SEIR 型)的元种群模型,用于模拟和监测(COVID-19)疫情的演变。基本模型由七个类别组成,即易感(S)、暴露(E)、三种感染类别、恢复(R)和死亡(D)。我们为 m 个不同空间位置的 n 个年龄和性别组定义了这些类别。因此,该模型包含了每个年龄组、性别和地点的所有流行病学类别。通过时变感染率矩阵来实现它们之间的混合。该模型使用纽约市及其行政区的每日新增感染曲线进行校准,包括人口普查数据以及每个年龄范围的感染、住院和死亡比例。我们最终得到了一个与报告曲线匹配并能准确预测不同地点和年龄组感染信息的模型。

https://cdn.ncbi.nlm.nih.gov/pmc/blobs/d624/8079423/d5f82f817de0/41598_2021_88281_Fig7_HTML.jpg
https://cdn.ncbi.nlm.nih.gov/pmc/blobs/d624/8079423/1b72b88a3658/41598_2021_88281_Fig1_HTML.jpg
https://cdn.ncbi.nlm.nih.gov/pmc/blobs/d624/8079423/d27a9c363877/41598_2021_88281_Fig2_HTML.jpg
https://cdn.ncbi.nlm.nih.gov/pmc/blobs/d624/8079423/8c85155bb0cb/41598_2021_88281_Fig3_HTML.jpg
https://cdn.ncbi.nlm.nih.gov/pmc/blobs/d624/8079423/1eedcf006dce/41598_2021_88281_Fig4_HTML.jpg
https://cdn.ncbi.nlm.nih.gov/pmc/blobs/d624/8079423/2bdc7b6292a4/41598_2021_88281_Fig5_HTML.jpg
https://cdn.ncbi.nlm.nih.gov/pmc/blobs/d624/8079423/ca65efbc6e6f/41598_2021_88281_Fig6_HTML.jpg
https://cdn.ncbi.nlm.nih.gov/pmc/blobs/d624/8079423/d5f82f817de0/41598_2021_88281_Fig7_HTML.jpg

相似文献

1
Estimating, monitoring, and forecasting COVID-19 epidemics: a spatiotemporal approach applied to NYC data.估算、监测和预测 COVID-19 疫情:应用于纽约市数据的时空方法。
Sci Rep. 2021 Apr 27;11(1):9089. doi: 10.1038/s41598-021-88281-w.
2
An integrated framework for building trustworthy data-driven epidemiological models: Application to the COVID-19 outbreak in New York City.建立可信数据驱动的流行病学模型的综合框架:在纽约市 COVID-19 爆发中的应用。
PLoS Comput Biol. 2021 Sep 8;17(9):e1009334. doi: 10.1371/journal.pcbi.1009334. eCollection 2021 Sep.
3
A versatile web app for identifying the drivers of COVID-19 epidemics.一个功能多样的网络应用程序,用于识别 COVID-19 疫情的驱动因素。
J Transl Med. 2021 Mar 16;19(1):109. doi: 10.1186/s12967-021-02736-2.
4
Forecasting the outcome and estimating the epidemic model parameters from the fatality time series in COVID-19 outbreaks.从 COVID-19 疫情的病死率时间序列预测结局并估计传染病模型参数。
Phys Biol. 2020 Sep 22;17(6):065002. doi: 10.1088/1478-3975/abac69.
5
An SEIR Model with Time-Varying Coefficients for Analyzing the SARS-CoV-2 Epidemic.一个时变系数的 SEIR 模型用于分析 SARS-CoV-2 疫情。
Risk Anal. 2023 Jan;43(1):144-155. doi: 10.1111/risa.13858. Epub 2021 Nov 19.
6
Covid-19 Dynamic Monitoring and Real-Time Spatio-Temporal Forecasting.Covid-19 动态监测与实时时空预测。
Front Public Health. 2021 Apr 8;9:641253. doi: 10.3389/fpubh.2021.641253. eCollection 2021.
7
Spatio-temporal data visualization for monitoring of control measures in the prevention of the spread of COVID-19 in Bosnia and Herzegovina.用于监测波斯尼亚和黑塞哥维那预防新冠病毒传播控制措施的时空数据可视化
Med Glas (Zenica). 2020 Aug 1;17(2):265-274. doi: 10.17392/1215-20.
8
Averting HIV infections in New York City: a modeling approach estimating the future impact of additional behavioral and biomedical HIV prevention strategies.避免在纽约市感染艾滋病毒:一种建模方法,用于估计额外的行为和生物医学艾滋病毒预防策略的未来影响。
PLoS One. 2013 Sep 13;8(9):e73269. doi: 10.1371/journal.pone.0073269. eCollection 2013.
9
Modeling COVID-19 epidemics in an Excel spreadsheet to enable first-hand accurate predictions of the pandemic evolution in urban areas.使用 Excel 电子表格对 COVID-19 疫情进行建模,以便能够对手头的疫情发展进行准确预测。
Sci Rep. 2021 Feb 22;11(1):4327. doi: 10.1038/s41598-021-83697-w.
10
SEIR order parameters and eigenvectors of the three stages of completed COVID-19 epidemics: with an illustration for Thailand January to May 2020.完成的 COVID-19 传染病三个阶段的 SEIR 序参量和特征向量:以 2020 年 1 月至 5 月泰国为例。
Phys Biol. 2021 May 13;18(4). doi: 10.1088/1478-3975/abf426.

引用本文的文献

1
Evidence-driven spatiotemporal COVID-19 hospitalization prediction with Ising dynamics.基于伊辛动力学的 COVID-19 住院预测的循证时空模型。
Nat Commun. 2023 May 29;14(1):3093. doi: 10.1038/s41467-023-38756-3.
2
Time-dependent vaccine efficacy estimation quantified by a mathematical model.基于数学模型的疫苗时效性效力评估。
PLoS One. 2023 May 11;18(5):e0285466. doi: 10.1371/journal.pone.0285466. eCollection 2023.
3
Real-time estimation and forecasting of COVID-19 cases and hospitalizations in Wisconsin HERC regions for public health decision making processes.

本文引用的文献

1
The impact of COVID-19 vaccination delay: A data-driven modeling analysis for Chicago and New York City.**译文**:COVID-19 疫苗接种延迟的影响:基于数据的芝加哥和纽约市建模分析。
Vaccine. 2021 Oct 1;39(41):6088-6094. doi: 10.1016/j.vaccine.2021.08.098. Epub 2021 Aug 31.
2
Mathematical model to assess the imposition of lockdown during COVID-19 pandemic.评估2019冠状病毒病大流行期间实施封锁措施的数学模型。
Results Phys. 2021 Jan;20:103716. doi: 10.1016/j.rinp.2020.103716. Epub 2020 Dec 25.
3
Stability analysis and optimal control of covid-19 with convex incidence rate in Khyber Pakhtunkhawa (Pakistan).
威斯康星州 HERC 地区实时估计和预测 COVID-19 病例和住院情况,以支持公共卫生决策过程。
BMC Public Health. 2023 Feb 17;23(1):359. doi: 10.1186/s12889-023-15160-6.
4
On the role of financial support programs in mitigating the SARS-CoV-2 spread in Brazil.论财政支持计划在减轻巴西 SARS-CoV-2 传播中的作用。
BMC Public Health. 2022 Sep 20;22(1):1781. doi: 10.1186/s12889-022-14155-z.
5
Nowcasting and forecasting COVID-19 waves: the recursive and stochastic nature of transmission.新冠疫情波的临近预报和预测:传播的递归性和随机性
R Soc Open Sci. 2022 Aug 24;9(8):220489. doi: 10.1098/rsos.220489. eCollection 2022 Aug.
6
Near real time monitoring and forecasting for COVID-19 situational awareness.针对新冠疫情态势感知的近实时监测与预测。
Appl Geogr. 2022 Sep;146:102759. doi: 10.1016/j.apgeog.2022.102759. Epub 2022 Aug 5.
7
From pandemic to a new normal: Strategies to optimise governmental interventions in Indonesia based on an SVEIQHR-type mathematical model.从大流行到新常态:基于SVEIQHR型数学模型优化印度尼西亚政府干预措施的策略
Infect Dis Model. 2022 Sep;7(3):346-363. doi: 10.1016/j.idm.2022.06.004. Epub 2022 Jun 30.
8
Immunity acquired by a minority active fraction of the population could explain COVID-19 spread in Greater Buenos Aires (June-November 2020).人群中少数活跃人群获得的免疫力可能解释了 2020 年 6 月至 11 月大布宜诺斯艾利斯地区(Greater Buenos Aires)的 COVID-19 传播。
Epidemiol Infect. 2022 Apr 22;150:e84. doi: 10.1017/S0950268822000656.
9
Modelling the persistence of Covid-19 positivity rate in Italy.意大利新冠病毒阳性率持续情况的建模。
Socioecon Plann Sci. 2022 Aug;82:101225. doi: 10.1016/j.seps.2022.101225. Epub 2022 Jan 7.
10
COVID-19 underreporting and its impact on vaccination strategies.COVID-19 漏报及其对疫苗接种策略的影响。
BMC Infect Dis. 2021 Oct 28;21(1):1111. doi: 10.1186/s12879-021-06780-7.
开伯尔-普赫图赫瓦省(巴基斯坦)新冠肺炎具有凸发病率的稳定性分析与最优控制
Results Phys. 2021 Jan;20:103703. doi: 10.1016/j.rinp.2020.103703. Epub 2020 Dec 17.
4
A mathematical model of Coronavirus Disease (COVID-19) containing asymptomatic and symptomatic classes.一种包含无症状和有症状类别的冠状病毒病(COVID-19)数学模型。
Results Phys. 2021 Feb;21:103776. doi: 10.1016/j.rinp.2020.103776. Epub 2021 Jan 6.
5
Analysis of Caputo fractional-order model for COVID-19 with lockdown.具有封锁措施的COVID-19的Caputo分数阶模型分析。
Adv Differ Equ. 2020;2020(1):394. doi: 10.1186/s13662-020-02853-0. Epub 2020 Aug 3.
6
Sex differential in COVID-19 mortality varies markedly by age.新冠病毒疾病(COVID-19)死亡率的性别差异在不同年龄段中有显著变化。
Lancet. 2020 Aug 22;396(10250):532-533. doi: 10.1016/S0140-6736(20)31748-7. Epub 2020 Aug 13.
7
SARS-CoV-2 Transmission and Infection Among Attendees of an Overnight Camp - Georgia, June 2020.2020年6月,佐治亚州一个过夜营地参与者中的新型冠状病毒传播与感染情况
MMWR Morb Mortal Wkly Rep. 2020 Aug 7;69(31):1023-1025. doi: 10.15585/mmwr.mm6931e1.
8
The challenges of modeling and forecasting the spread of COVID-19.新冠病毒传播建模和预测面临的挑战。
Proc Natl Acad Sci U S A. 2020 Jul 21;117(29):16732-16738. doi: 10.1073/pnas.2006520117. Epub 2020 Jul 2.
9
Inferring change points in the spread of COVID-19 reveals the effectiveness of interventions.推断 COVID-19 传播中的变化点可揭示干预措施的效果。
Science. 2020 Jul 10;369(6500). doi: 10.1126/science.abb9789. Epub 2020 May 15.
10
Gender Differences in Patients With COVID-19: Focus on Severity and Mortality.COVID-19 患者的性别差异:关注严重程度和死亡率。
Front Public Health. 2020 Apr 29;8:152. doi: 10.3389/fpubh.2020.00152. eCollection 2020.