• 文献检索
  • 文档翻译
  • 深度研究
  • 学术资讯
  • Suppr Zotero 插件Zotero 插件
  • 邀请有礼
  • 套餐&价格
  • 历史记录
应用&插件
Suppr Zotero 插件Zotero 插件浏览器插件Mac 客户端Windows 客户端微信小程序
定价
高级版会员购买积分包购买API积分包
服务
文献检索文档翻译深度研究API 文档MCP 服务
关于我们
关于 Suppr公司介绍联系我们用户协议隐私条款
关注我们

Suppr 超能文献

核心技术专利:CN118964589B侵权必究
粤ICP备2023148730 号-1Suppr @ 2026

文献检索

告别复杂PubMed语法,用中文像聊天一样搜索,搜遍4000万医学文献。AI智能推荐,让科研检索更轻松。

立即免费搜索

文件翻译

保留排版,准确专业,支持PDF/Word/PPT等文件格式,支持 12+语言互译。

免费翻译文档

深度研究

AI帮你快速写综述,25分钟生成高质量综述,智能提取关键信息,辅助科研写作。

立即免费体验

新冠病毒病的多波疫情:一种路径模型方法

Multiple waves of COVID-19: a pathway model approach.

作者信息

Vasconcelos Giovani L, Pessoa Nathan L, Silva Natan B, Macêdo Antônio M S, Brum Arthur A, Ospina Raydonal, Tirnakli Ugur

机构信息

Departamento de Física, Universidade Federal do Paraná, Curitiba, Paraná 81531-980 Brazil.

Departamento de Física, Universidade Federal de Pernambuco, Recife, Pernambuco 50670-901 Brazil.

出版信息

Nonlinear Dyn. 2023;111(7):6855-6872. doi: 10.1007/s11071-022-08179-8. Epub 2022 Dec 23.

DOI:10.1007/s11071-022-08179-8
PMID:36588986
原文链接:https://pmc.ncbi.nlm.nih.gov/articles/PMC9786534/
Abstract

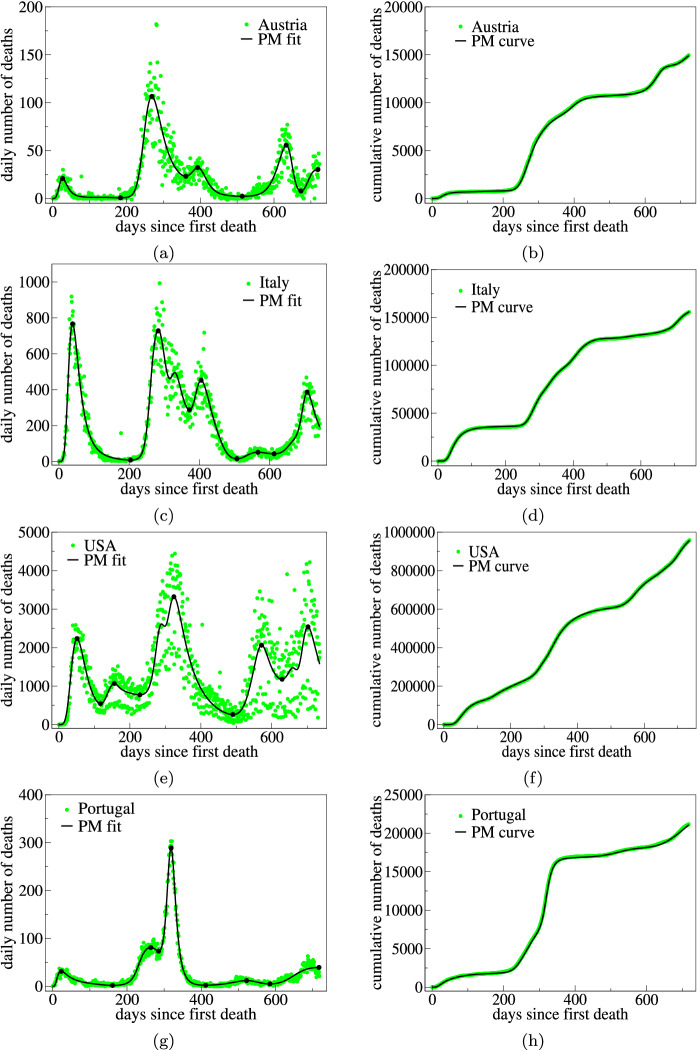
A generalized pathway model, with time-dependent parameters, is applied to describe the mortality curves of the COVID-19 disease for several countries that exhibit multiple waves of infections. The pathway approach adopted here is formulated explicitly in time, in the sense that the model's growth rate for the number of deaths or infections is written as an explicit function of time, rather than in terms of the cumulative quantity itself. This allows for a direct fit of the model to daily data (new deaths or new cases) without the need of any integration. The model is applied to COVID-19 mortality curves for ten selected countries and found to be in very good agreement with the data for all cases considered. From the fitted theoretical curves for a given location, relevant epidemiological information can be extracted, such as the starting and peak dates for each successive wave. It is argued that obtaining reliable estimates for such characteristic points is important for studying the effectiveness of interventions and the possible negative impact of their relaxation, as it allows for a direct comparison of the time of adoption/relaxation of control measures with the peaks and troughs of the epidemic curve.

摘要

一个具有随时间变化参数的广义路径模型被用于描述几个出现多波感染的国家的新冠肺炎疾病死亡率曲线。这里采用的路径方法在时间上有明确的表述,即模型中死亡人数或感染人数的增长率被写成时间的显式函数,而不是基于累积数量本身。这使得模型能够直接拟合每日数据(新增死亡或新增病例),而无需任何积分。该模型应用于十个选定国家的新冠肺炎死亡率曲线,发现与所有考虑的病例数据非常吻合。从给定地点的拟合理论曲线中,可以提取相关的流行病学信息,例如每一波疫情的起始日期和峰值日期。有人认为,获得这些特征点的可靠估计对于研究干预措施的有效性及其放松可能产生的负面影响很重要,因为它允许直接比较控制措施的采用/放松时间与疫情曲线的峰值和谷值。

https://cdn.ncbi.nlm.nih.gov/pmc/blobs/7cc8/9786534/50beb24d2eca/11071_2022_8179_Fig8_HTML.jpg
https://cdn.ncbi.nlm.nih.gov/pmc/blobs/7cc8/9786534/a0778ad0f491/11071_2022_8179_Fig1_HTML.jpg
https://cdn.ncbi.nlm.nih.gov/pmc/blobs/7cc8/9786534/843f13405c37/11071_2022_8179_Fig2_HTML.jpg
https://cdn.ncbi.nlm.nih.gov/pmc/blobs/7cc8/9786534/e4a965894ea0/11071_2022_8179_Fig3_HTML.jpg
https://cdn.ncbi.nlm.nih.gov/pmc/blobs/7cc8/9786534/6796864a3164/11071_2022_8179_Fig4_HTML.jpg
https://cdn.ncbi.nlm.nih.gov/pmc/blobs/7cc8/9786534/5ed92fd3517b/11071_2022_8179_Fig5_HTML.jpg
https://cdn.ncbi.nlm.nih.gov/pmc/blobs/7cc8/9786534/722cc2eee158/11071_2022_8179_Fig6_HTML.jpg
https://cdn.ncbi.nlm.nih.gov/pmc/blobs/7cc8/9786534/b974c86da13e/11071_2022_8179_Fig7_HTML.jpg
https://cdn.ncbi.nlm.nih.gov/pmc/blobs/7cc8/9786534/50beb24d2eca/11071_2022_8179_Fig8_HTML.jpg

相似文献

1
Multiple waves of COVID-19: a pathway model approach.新冠病毒病的多波疫情:一种路径模型方法
Nonlinear Dyn. 2023;111(7):6855-6872. doi: 10.1007/s11071-022-08179-8. Epub 2022 Dec 23.
2
Folic acid supplementation and malaria susceptibility and severity among people taking antifolate antimalarial drugs in endemic areas.在流行地区,服用抗叶酸抗疟药物的人群中,叶酸补充剂与疟疾易感性和严重程度的关系。
Cochrane Database Syst Rev. 2022 Feb 1;2(2022):CD014217. doi: 10.1002/14651858.CD014217.
3
[The wave train of COVID-19 infections].[新冠病毒感染的波状序列]
Epidemiol Prev. 2021 Nov-Dec;45(6):580-587. doi: 10.19191/EP21.6.121.
4
Alternative graphical displays for the monitoring of epidemic outbreaks, with application to COVID-19 mortality.用于监测传染病暴发的替代图形显示,应用于 COVID-19 死亡率。
BMC Med Res Methodol. 2020 Oct 6;20(1):248. doi: 10.1186/s12874-020-01122-8.
5
Predicting of the Coronavirus Disease 2019 (COVID-19) Epidemic Using Estimation of Parameters in the Logistic Growth Model.使用逻辑增长模型中的参数估计预测2019年冠状病毒病(COVID-19)疫情
Infect Dis Rep. 2021 May 24;13(2):465-485. doi: 10.3390/idr13020046.
6
Impact of COVID-19 Testing Strategies and Lockdowns on Disease Management Across Europe, South America, and the United States: Analysis Using Skew-Normal Distributions.新型冠状病毒肺炎检测策略和封锁措施对欧洲、南美洲及美国疾病管理的影响:基于偏态正态分布的分析
JMIRx Med. 2021 Apr 21;2(2):e21269. doi: 10.2196/21269. eCollection 2021 Apr-Jun.
7
Data analysis and prediction of the COVID-19 outbreak in the first and second waves for top 5 affected countries in the world.对世界上受影响最严重的5个国家第一波和第二波新冠疫情爆发情况的数据分析与预测。
Nonlinear Dyn. 2022;109(1):77-90. doi: 10.1007/s11071-022-07473-9. Epub 2022 May 7.
8
Using GAM functions and Markov-Switching models in an evaluation framework to assess countries' performance in controlling the COVID-19 pandemic.运用 GAM 函数和马尔可夫转换模型于评估框架内,评估各国在控制新冠疫情方面的表现。
BMC Public Health. 2021 Nov 27;21(1):2173. doi: 10.1186/s12889-021-11891-6.
9
A new SEAIRD pandemic prediction model with clinical and epidemiological data analysis on COVID-19 outbreak.一种基于新冠肺炎疫情临床和流行病学数据分析的新型SEAIRD大流行预测模型。
Appl Intell (Dordr). 2021;51(7):4162-4198. doi: 10.1007/s10489-020-01938-3. Epub 2021 Jan 1.
10
Phenomenological Modelling of COVID-19 Epidemics in Sri Lanka, Italy, the United States, and Hebei Province of China.斯里兰卡、意大利、美国和中国河北省 COVID-19 疫情的现象学建模。
Comput Math Methods Med. 2020 Oct 18;2020:6397063. doi: 10.1155/2020/6397063. eCollection 2020.

引用本文的文献

1
A decavalent composite mRNA vaccine against both influenza and COVID-19.一种针对流感和 COVID-19 的十价复合 mRNA 疫苗。
mBio. 2024 Sep 11;15(9):e0066824. doi: 10.1128/mbio.00668-24. Epub 2024 Aug 6.
2
Generalizing the Wells-Riley Infection Probability: A Superstatistical Scheme for Indoor Infection Risk Estimation.推广威尔斯-莱利感染概率:一种用于室内感染风险估计的超统计方案。
Entropy (Basel). 2023 Jun 2;25(6):896. doi: 10.3390/e25060896.
3
Sources, diffusion and prediction in COVID-19 pandemic: lessons learned to face next health emergency.

本文引用的文献

1
ModInterv COVID-19: An online platform to monitor the evolution of epidemic curves.ModInterv COVID-19:一个监测疫情曲线演变的在线平台。
Appl Soft Comput. 2023 Apr;137:110159. doi: 10.1016/j.asoc.2023.110159. Epub 2023 Feb 27.
2
The starting dates of COVID-19 multiple waves.COVID-19 多波次的起始日期。
Chaos. 2022 Mar;32(3):031101. doi: 10.1063/5.0079904.
3
An Easy-to-Use Public Health-Driven Method (the Generalized Logistic Differential Equation Model) Accurately Simulated COVID-19 Epidemic in Wuhan and Correctly Determined the Early Warning Time.
新冠疫情中的信息源、传播与预测:应对下一次卫生紧急事件的经验教训
AIMS Public Health. 2023 Mar 2;10(1):145-168. doi: 10.3934/publichealth.2023012. eCollection 2023.
一种易于使用的公共卫生驱动方法(广义逻辑斯蒂微分方程模型)准确模拟了武汉的 COVID-19 疫情,并正确确定了预警时间。
Front Public Health. 2022 Mar 7;10:813860. doi: 10.3389/fpubh.2022.813860. eCollection 2022.
4
Factors shaping the COVID-19 epidemic curve: a multi-country analysis.影响新冠疫情曲线的因素:多国分析。
BMC Infect Dis. 2021 Oct 2;21(1):1032. doi: 10.1186/s12879-021-06714-3.
5
Second waves, social distancing, and the spread of COVID-19 across the USA.第二波疫情、社交距离措施与新冠病毒在美国的传播
Wellcome Open Res. 2021 Mar 15;5:103. doi: 10.12688/wellcomeopenres.15986.3. eCollection 2020.
6
Power law behaviour in the saturation regime of fatality curves of the COVID-19 pandemic.COVID-19 大流行病死率曲线饱和阶段的幂律行为。
Sci Rep. 2021 Feb 25;11(1):4619. doi: 10.1038/s41598-021-84165-1.
7
Second wave COVID-19 pandemics in Europe: a temporal playbook.欧洲的第二波 COVID-19 大流行:时间安排手册。
Sci Rep. 2020 Sep 23;10(1):15514. doi: 10.1038/s41598-020-72611-5.
8
Dynamic causal modelling of COVID-19.新型冠状病毒肺炎的动态因果模型
Wellcome Open Res. 2020 Aug 7;5:89. doi: 10.12688/wellcomeopenres.15881.2. eCollection 2020.
9
Modelling fatality curves of COVID-19 and the effectiveness of intervention strategies.新冠病毒病死亡曲线建模及干预策略的有效性
PeerJ. 2020 Jun 23;8:e9421. doi: 10.7717/peerj.9421. eCollection 2020.
10
Seasonality of Respiratory Viral Infections.呼吸道病毒感染的季节性。
Annu Rev Virol. 2020 Sep 29;7(1):83-101. doi: 10.1146/annurev-virology-012420-022445. Epub 2020 Mar 20.