• 文献检索
  • 文档翻译
  • 深度研究
  • 学术资讯
  • Suppr Zotero 插件Zotero 插件
  • 邀请有礼
  • 套餐&价格
  • 历史记录
应用&插件
Suppr Zotero 插件Zotero 插件浏览器插件Mac 客户端Windows 客户端微信小程序
定价
高级版会员购买积分包购买API积分包
服务
文献检索文档翻译深度研究API 文档MCP 服务
关于我们
关于 Suppr公司介绍联系我们用户协议隐私条款
关注我们

Suppr 超能文献

核心技术专利:CN118964589B侵权必究
粤ICP备2023148730 号-1Suppr @ 2026

文献检索

告别复杂PubMed语法,用中文像聊天一样搜索,搜遍4000万医学文献。AI智能推荐,让科研检索更轻松。

立即免费搜索

文件翻译

保留排版,准确专业,支持PDF/Word/PPT等文件格式,支持 12+语言互译。

免费翻译文档

深度研究

AI帮你快速写综述,25分钟生成高质量综述,智能提取关键信息,辅助科研写作。

立即免费体验

基于数据驱动编码对韩国、意大利和伊朗的 COVID-19 传播情况进行预测。

Prediction of COVID-19 spreading profiles in South Korea, Italy and Iran by data-driven coding.

机构信息

School of Computing, South China Normal University, Guangzhou, China.

Department of Electrical Engineering, City University of Hong Kong, Hong Kong, China.

出版信息

PLoS One. 2020 Jul 6;15(7):e0234763. doi: 10.1371/journal.pone.0234763. eCollection 2020.

DOI:10.1371/journal.pone.0234763
PMID:32628673
原文链接:https://pmc.ncbi.nlm.nih.gov/articles/PMC7337285/
Abstract

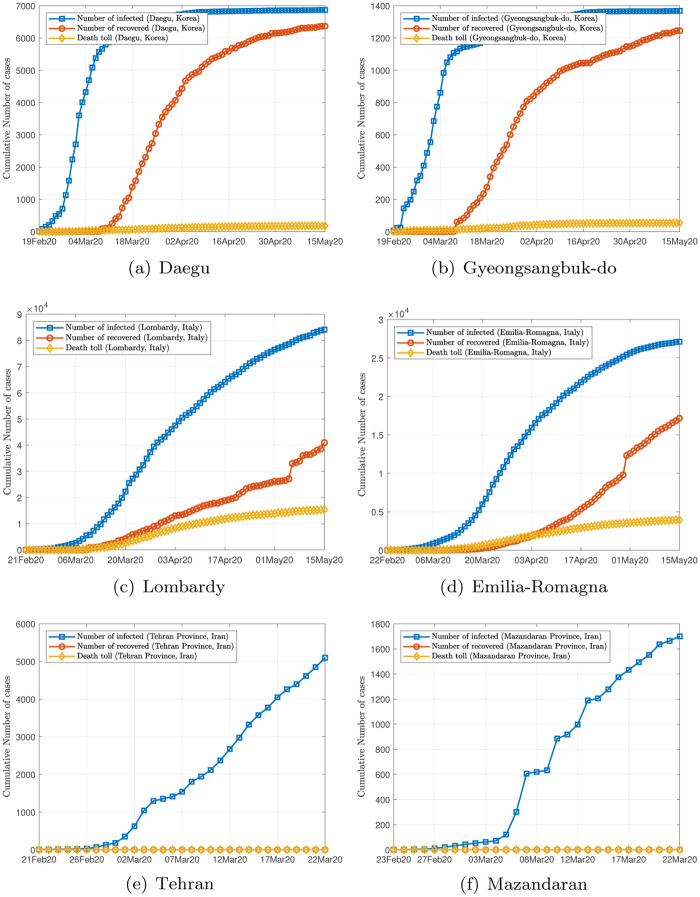
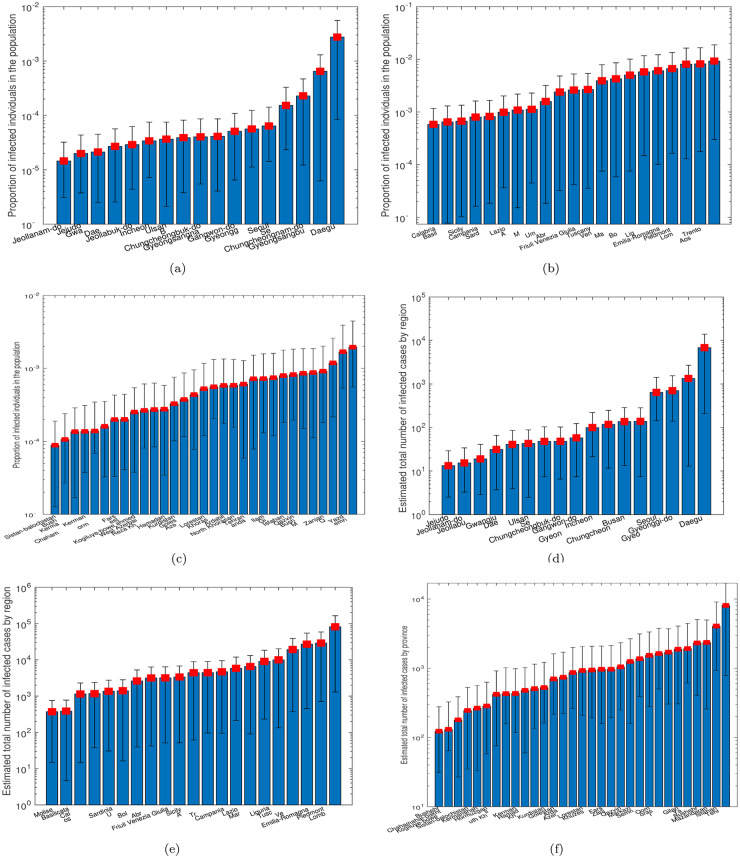
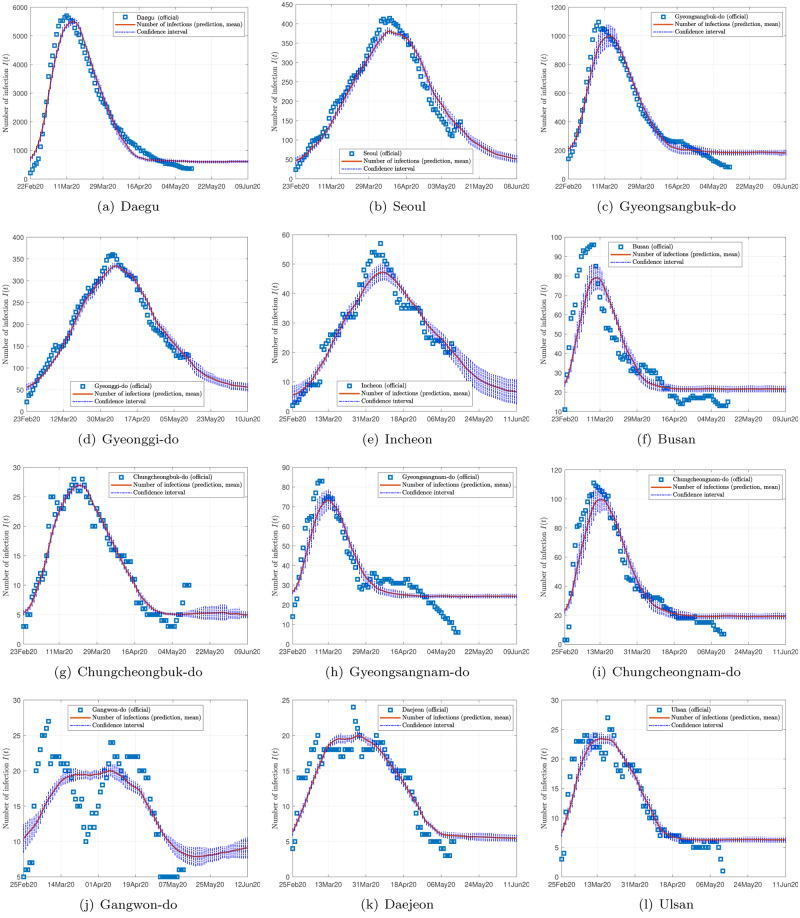
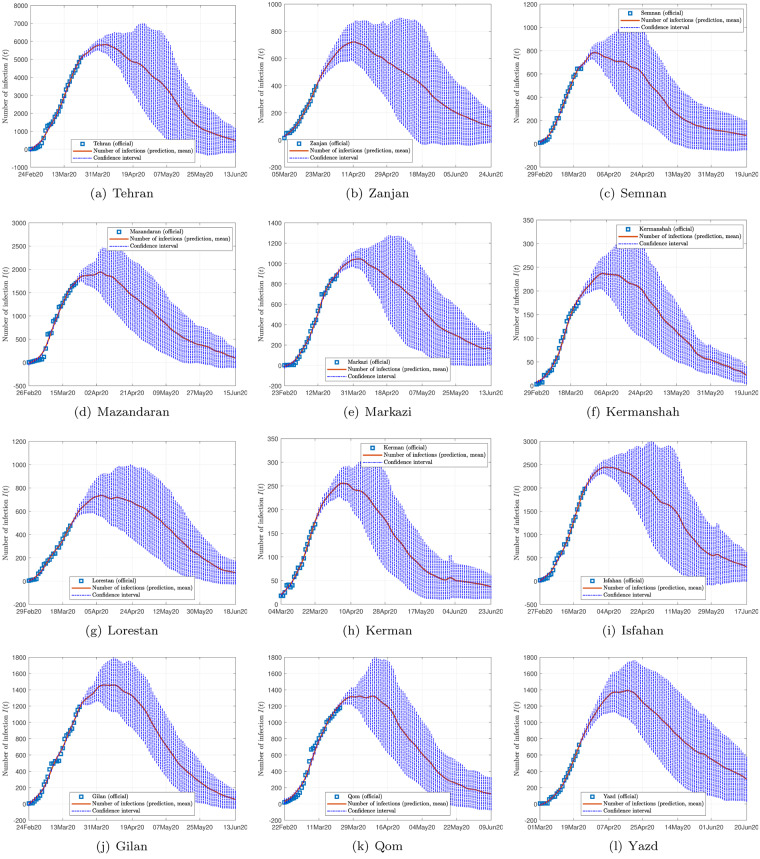
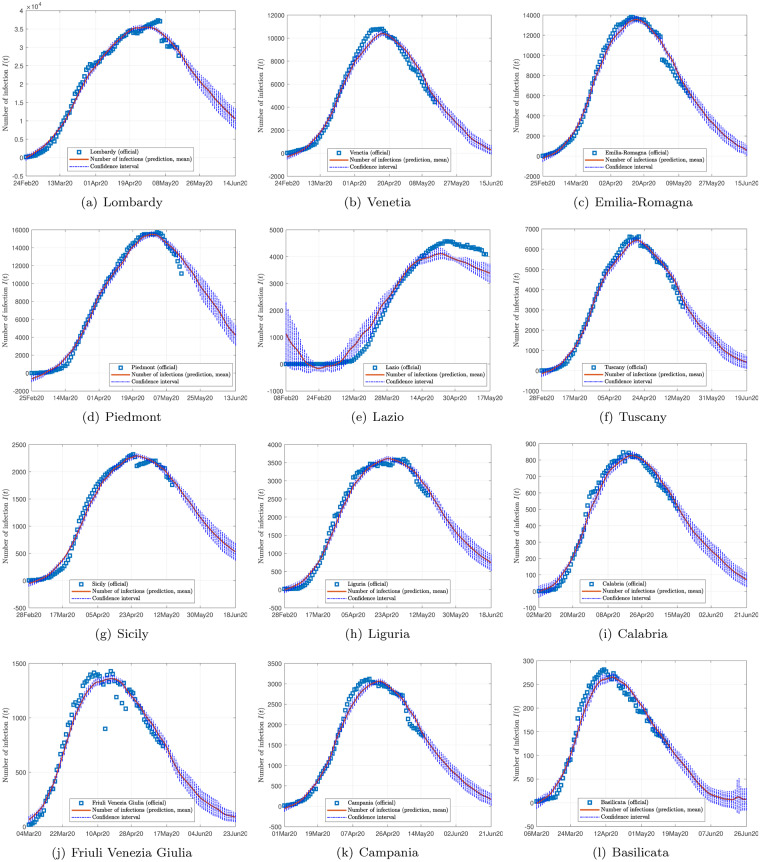
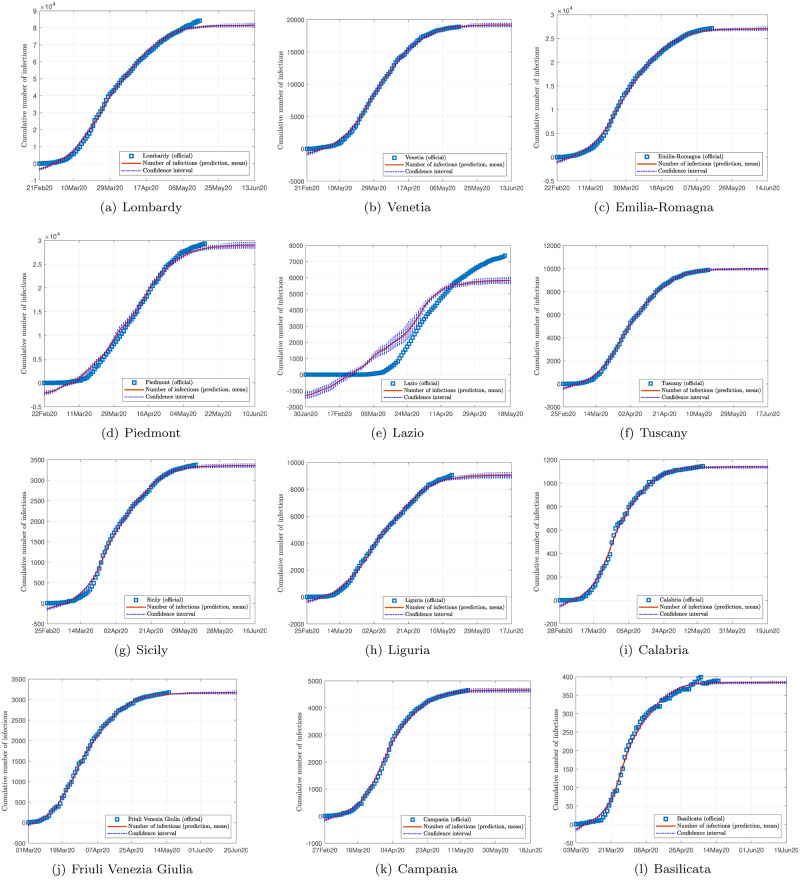
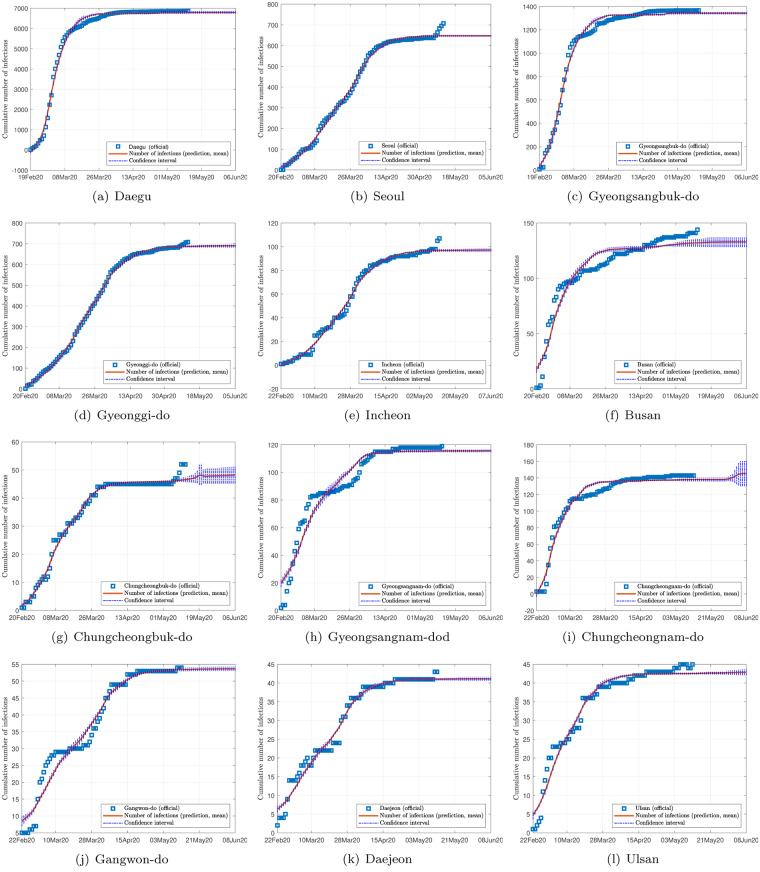
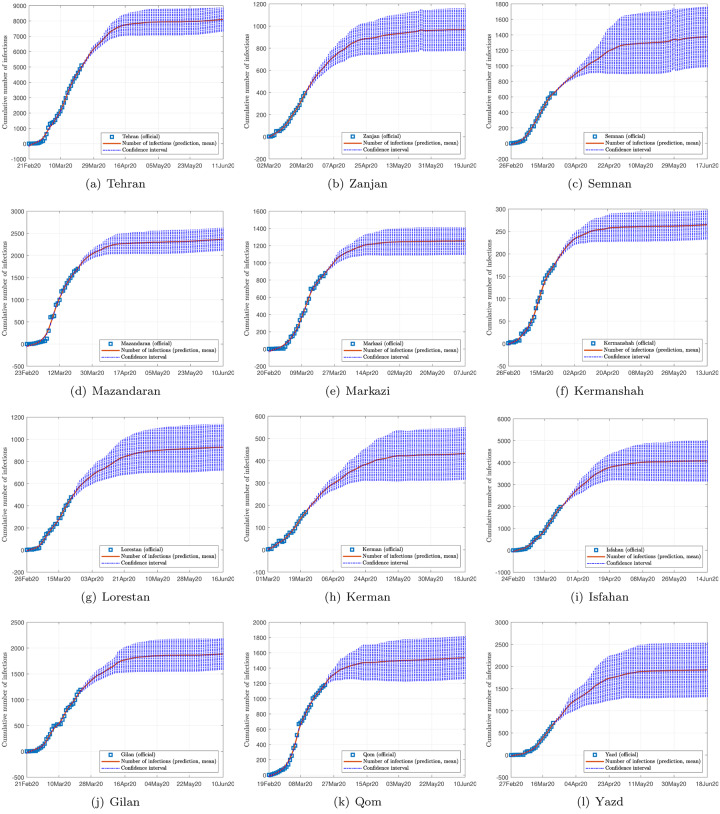
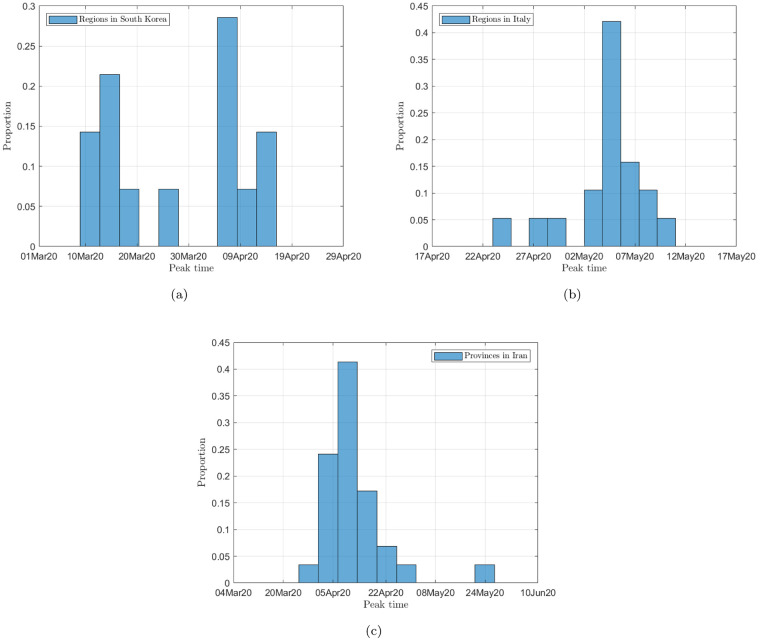
This work applies a data-driven coding method for prediction of the COVID-19 spreading profile in any given population that shows an initial phase of epidemic progression. Based on the historical data collected for COVID-19 spreading in 367 cities in China and the set of parameters of the augmented Susceptible-Exposed-Infected-Removed (SEIR) model obtained for each city, a set of profile codes representing a variety of transmission mechanisms and contact topologies is formed. By comparing the data of an early outbreak of a given population with the complete set of historical profiles, the best fit profiles are selected and the corresponding sets of profile codes are used for prediction of the future progression of the epidemic in that population. Application of the method to the data collected for South Korea, Italy and Iran shows that peaks of infection cases are expected to occur before mid April, the end of March and the end of May 2020, and that the percentage of population infected in each city or region will be less than 0.01%, 0.5% and 0.5%, for South Korea, Italy and Iran, respectively.

摘要

这项工作应用了一种数据驱动的编码方法,用于预测任何给定人群中 COVID-19 的传播情况,这些人群显示出疫情发展的初始阶段。基于为中国 367 个城市的 COVID-19 传播收集的历史数据以及为每个城市获得的增强型易感-暴露-感染-清除(SEIR)模型的参数集,形成了一组表示各种传播机制和接触拓扑的配置文件代码。通过将给定人群的早期疫情数据与完整的历史配置文件集进行比较,选择最佳拟合配置文件,并使用相应的配置文件代码集来预测该人群中疫情的未来发展。该方法在为韩国、意大利和伊朗收集的数据中的应用表明,感染病例的峰值预计将分别在 2020 年 4 月中旬、3 月底和 5 月底出现,并且每个城市或地区的感染人口比例将分别小于韩国的 0.01%、意大利的 0.5%和伊朗的 0.5%。

https://cdn.ncbi.nlm.nih.gov/pmc/blobs/dd4e/7337285/5801dc14f803/pone.0234763.g009.jpg
https://cdn.ncbi.nlm.nih.gov/pmc/blobs/dd4e/7337285/04d15577e1cf/pone.0234763.g001.jpg
https://cdn.ncbi.nlm.nih.gov/pmc/blobs/dd4e/7337285/1ecd9b070dac/pone.0234763.g002.jpg
https://cdn.ncbi.nlm.nih.gov/pmc/blobs/dd4e/7337285/607d46b5b038/pone.0234763.g003.jpg
https://cdn.ncbi.nlm.nih.gov/pmc/blobs/dd4e/7337285/4db17397c46b/pone.0234763.g004.jpg
https://cdn.ncbi.nlm.nih.gov/pmc/blobs/dd4e/7337285/5f2ff8ba0b2b/pone.0234763.g005.jpg
https://cdn.ncbi.nlm.nih.gov/pmc/blobs/dd4e/7337285/3863c434dec7/pone.0234763.g006.jpg
https://cdn.ncbi.nlm.nih.gov/pmc/blobs/dd4e/7337285/e85ea2c1e0b6/pone.0234763.g007.jpg
https://cdn.ncbi.nlm.nih.gov/pmc/blobs/dd4e/7337285/2fefcab144ed/pone.0234763.g008.jpg
https://cdn.ncbi.nlm.nih.gov/pmc/blobs/dd4e/7337285/5801dc14f803/pone.0234763.g009.jpg

相似文献

1
Prediction of COVID-19 spreading profiles in South Korea, Italy and Iran by data-driven coding.基于数据驱动编码对韩国、意大利和伊朗的 COVID-19 传播情况进行预测。
PLoS One. 2020 Jul 6;15(7):e0234763. doi: 10.1371/journal.pone.0234763. eCollection 2020.
2
The prediction for development of COVID-19 in global major epidemic areas through empirical trends in China by utilizing state transition matrix model.利用状态转移矩阵模型,根据中国的经验趋势预测全球主要疫区 COVID-19 的发展情况。
BMC Infect Dis. 2020 Sep 29;20(1):710. doi: 10.1186/s12879-020-05417-5.
3
Covid-19 Outbreak Progression in Italian Regions: Approaching the Peak by the End of March in Northern Italy and First Week of April in Southern Italy.意大利各地区的新冠疫情进展:北部地区将于 3 月底达到高峰,南部地区将于 4 月初达到高峰。
Int J Environ Res Public Health. 2020 Apr 27;17(9):3025. doi: 10.3390/ijerph17093025.
4
Geographic risk assessment of COVID-19 transmission using recent data: An observational study.利用近期数据进行新冠病毒传播的地理风险评估:一项观察性研究。
Medicine (Baltimore). 2020 Jun 12;99(24):e20774. doi: 10.1097/MD.0000000000020774.
5
Comparative infection modeling and control of COVID-19 transmission patterns in China, South Korea, Italy and Iran.中国、韩国、意大利和伊朗的 COVID-19 传播模式比较感染建模与控制。
Sci Total Environ. 2020 Dec 10;747:141447. doi: 10.1016/j.scitotenv.2020.141447. Epub 2020 Aug 3.
6
The second worldwide wave of interest in coronavirus since the COVID-19 outbreaks in South Korea, Italy and Iran: A Google Trends study.自韩国、意大利和伊朗爆发新冠疫情以来,全球对冠状病毒的第二轮关注热潮:一项谷歌趋势研究。
Brain Behav Immun. 2020 Aug;88:950-951. doi: 10.1016/j.bbi.2020.04.042. Epub 2020 Apr 18.
7
Data-driven modelling and prediction of COVID-19 infection in India and correlation analysis of the virus transmission with socio-economic factors.印度COVID-19感染的数据驱动建模与预测以及病毒传播与社会经济因素的相关性分析。
Diabetes Metab Syndr. 2020 Sep-Oct;14(5):1231-1240. doi: 10.1016/j.dsx.2020.07.008. Epub 2020 Jul 9.
8
Mathematical models for devising the optimal SARS-CoV-2 strategy for eradication in China, South Korea, and Italy.用于制定中国、韩国和意大利最优 SARS-CoV-2 消除策略的数学模型。
J Transl Med. 2020 Sep 5;18(1):345. doi: 10.1186/s12967-020-02513-7.
9
Will the Third Wave of Coronavirus Disease 2019 Really Come in Korea?2019冠状病毒病的第三波疫情真的会在韩国出现吗?
J Korean Med Sci. 2020 Mar 16;35(10):e110. doi: 10.3346/jkms.2020.35.e110.
10
Anosmia as a prominent symptom of COVID-19 infection.嗅觉丧失是 COVID-19 感染的突出症状。
Rhinology. 2020 Jun 1;58(3):302-303. doi: 10.4193/Rhin20.140.

引用本文的文献

1
Applications of time series analysis in epidemiology: Literature review and our experience during COVID-19 pandemic.时间序列分析在流行病学中的应用:文献综述及我们在新冠疫情期间的经验
World J Clin Cases. 2023 Oct 16;11(29):6974-6983. doi: 10.12998/wjcc.v11.i29.6974.
2
Epidemiologic Parameters for COVID-19: A Systematic Review and Meta-Analysis.新型冠状病毒肺炎的流行病学参数:一项系统综述与荟萃分析
Med J Islam Repub Iran. 2022 Dec 19;36:155. doi: 10.47176/mjiri.36.155. eCollection 2022.
3
Big data analysis of the impact of COVID-19 on digital game industrial sustainability in South Korea.

本文引用的文献

1
Modeling and prediction of the 2019 coronavirus disease spreading in China incorporating human migration data.结合人口迁移数据对中国 2019 年冠状病毒病传播的建模与预测。
PLoS One. 2020 Oct 27;15(10):e0241171. doi: 10.1371/journal.pone.0241171. eCollection 2020.
2
General Model for COVID-19 Spreading With Consideration of Intercity Migration, Insufficient Testing, and Active Intervention: Modeling Study of Pandemic Progression in Japan and the United States.考虑到城市间迁移、检测不足和主动干预的 COVID-19 传播通用模型:日本和美国大流行进展的建模研究。
JMIR Public Health Surveill. 2020 Jul 3;6(3):e18880. doi: 10.2196/18880.
3
大数据分析 COVID-19 对韩国数字游戏产业可持续性的影响。
PLoS One. 2022 Dec 30;17(12):e0278467. doi: 10.1371/journal.pone.0278467. eCollection 2022.
4
How do the smart travel ban policy and intercity travel pattern affect COVID-19 trends? Lessons learned from Iran.智能旅行禁令政策和城际旅行模式如何影响 COVID-19 趋势?来自伊朗的经验教训。
PLoS One. 2022 Oct 18;17(10):e0276276. doi: 10.1371/journal.pone.0276276. eCollection 2022.
5
Using simulation modelling and systems science to help contain COVID-19: A systematic review.利用模拟建模和系统科学助力控制2019冠状病毒病:一项系统综述
Syst Res Behav Sci. 2022 Aug 19. doi: 10.1002/sres.2897.
6
Estimating unconfirmed COVID-19 infection cases and multiple waves of pandemic progression with consideration of testing capacity and non-pharmaceutical interventions: A dynamic spreading model.考虑检测能力和非药物干预措施来估计未确诊的新冠病毒感染病例及多波疫情进展:一种动态传播模型
Inf Sci (N Y). 2022 Aug;607:418-439. doi: 10.1016/j.ins.2022.05.093. Epub 2022 Jun 6.
7
Random-Forest-Bagging Broad Learning System With Applications for COVID-19 Pandemic.用于COVID-19大流行的随机森林装袋广义学习系统
IEEE Internet Things J. 2021 Mar 17;8(21):15906-15918. doi: 10.1109/JIOT.2021.3066575. eCollection 2021 Nov.
8
Forecasting of a complex phenomenon using stochastic data-based techniques under non-conventional schemes: The SARS-CoV-2 virus spread case.在非常规方案下使用基于随机数据的技术对复杂现象进行预测:严重急性呼吸综合征冠状病毒2(SARS-CoV-2)病毒传播案例。
Chaos Solitons Fractals. 2022 May;158:112097. doi: 10.1016/j.chaos.2022.112097. Epub 2022 Apr 7.
9
The efficacy of deep learning based LSTM model in forecasting the outbreak of contagious diseases.基于深度学习的长短期记忆模型在预测传染病爆发方面的功效。
Infect Dis Model. 2022 Mar;7(1):170-183. doi: 10.1016/j.idm.2021.12.005. Epub 2021 Dec 28.
10
Time series analysis and predicting COVID-19 affected patients by ARIMA model using machine learning.基于机器学习的 ARIMA 模型对 COVID-19 影响患者的时间序列分析与预测。
J Virol Methods. 2022 Mar;301:114433. doi: 10.1016/j.jviromet.2021.114433. Epub 2021 Dec 14.
Population flow drives spatio-temporal distribution of COVID-19 in China.
人口流动驱动中国 COVID-19 的时空分布。
Nature. 2020 Jun;582(7812):389-394. doi: 10.1038/s41586-020-2284-y. Epub 2020 Apr 29.
4
Clustering model for transmission of the SARS virus: application to epidemic control and risk assessment.严重急性呼吸综合征病毒传播的聚类模型:在疫情防控与风险评估中的应用
Physica A. 2005 Jun 15;351(2):499-511. doi: 10.1016/j.physa.2005.01.009. Epub 2005 Jan 26.
5
Super-spreaders and the rate of transmission of the SARS virus.超级传播者与非典病毒的传播率
Physica D. 2006 Mar 15;215(2):146-158. doi: 10.1016/j.physd.2006.01.021. Epub 2006 Mar 10.
6
Humanity tested.人类试验。
Nat Biomed Eng. 2020 Apr;4(4):355-356. doi: 10.1038/s41551-020-0553-6.
7
The effect of travel restrictions on the spread of the 2019 novel coronavirus (COVID-19) outbreak.旅行限制对 2019 年新型冠状病毒(COVID-19)疫情传播的影响。
Science. 2020 Apr 24;368(6489):395-400. doi: 10.1126/science.aba9757. Epub 2020 Mar 6.
8
Risk for Transportation of Coronavirus Disease from Wuhan to Other Cities in China.从武汉向中国其他城市传播冠状病毒病的风险。
Emerg Infect Dis. 2020 May;26(5):1049-1052. doi: 10.3201/eid2605.200146. Epub 2020 May 17.
9
Nowcasting and forecasting the potential domestic and international spread of the 2019-nCoV outbreak originating in Wuhan, China: a modelling study.实时预测和预报源自中国武汉的 2019-nCoV 疫情在国内和国际的潜在传播:一项建模研究。
Lancet. 2020 Feb 29;395(10225):689-697. doi: 10.1016/S0140-6736(20)30260-9. Epub 2020 Jan 31.
10
Early Transmission Dynamics in Wuhan, China, of Novel Coronavirus-Infected Pneumonia.新型冠状病毒感染肺炎在中国武汉的早期传播动力学。
N Engl J Med. 2020 Mar 26;382(13):1199-1207. doi: 10.1056/NEJMoa2001316. Epub 2020 Jan 29.